
Reading Time:
Key points
- Cyclical fluctuations are a key aspect of investment markets. Most are driven by economic developments but get magnified by swings in investor sentiment.
- Of particular importance are the long-term cycles which are often driven by waves of innovation and the 3–5 year business cycle. Lately we have been in the benign phase of the business cycle and may have be entering a weaker and more constrained phase of the long-term cycle.
- Periods of poor returns invariably give way to great returns and vice versa. The key is to not get thrown by them.
“The stock market is the story of cycles and of the human behaviour that is responsible for overreactions in both directions.”
Seth Klarman( hedge fund manager and investor).“History doesn’t repeat but it rhymes.”
Often attributed to Mark Twain.
Introduction
Whether it be the cycle of day and night, seasons, tides, the weather, fertility cycles, birth and death, etc, cycles are integral to life. And so too for economies and investment markets. Some are regular, some just rhyme. Despite attempts to end or subdue them via economic policy and regulation they live on. Usually when we declare investment cycles dead, they come back to bite us. Sometimes they bring much joy to investors, but they can also bring much angst. But what are they? What causes them? And why do investors need to be aware of them? This is particularly relevant after several years of great investment returns.
Cycles in cycles
Cycles in investment markets invariably refer to swings between good and bad returns. They usually take their lead from fundamental economic & financial developments but are magnified by waves of investor optimism and pessimism. There are three cycles of particular relevance.
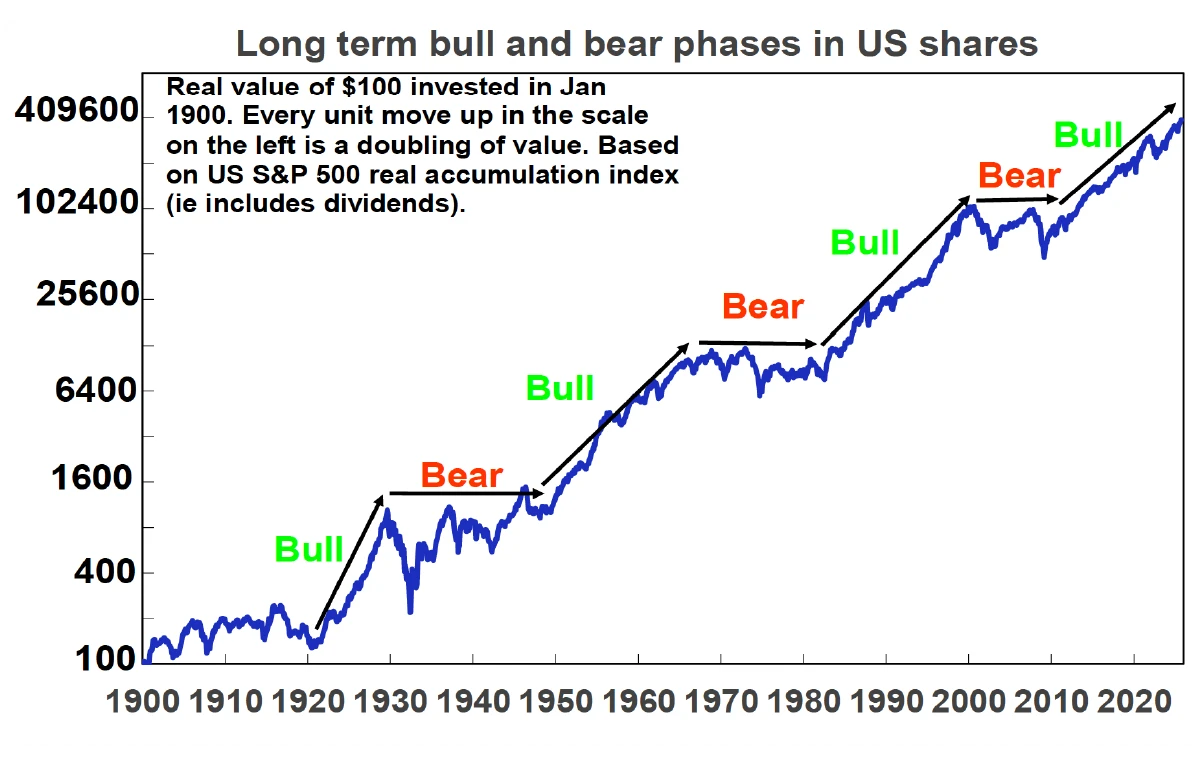
Long term or secular cycles – share markets go through long term or secular bull and bear phases, often lasting between 10 to 20 years. This is most clearly evident in the US share market and illustrated by the next chart.
Source: Bloomberg, R.Shiller, AMP
It shows the cumulative real value of $100 invested in 1900. Secular bull markets – or 10-20 year periods where the trend in shares is up – can be seen in the 1920s, 1950s and 60s, the 1980s and 90s and over the past decade. In between in the 1930s and 1940s, 1970s and 2000s are secular bear markets – which are long periods where shares have poor and volatile returns.
Secular bull and bear phases are often related to what is known as Kondratiev waves, which take their lead from waves of technological innovation. Starting in the 1780s, water power, textiles and iron drove the first industrial revolution; steam, rail and steel drove the second industrial revolution; electricity, chemicals and the internal combustion engine drove a third Kondratiev wave into the 1920s; petro chemicals, electronics and aviation drove a fourth in the 1950s and 1960s; the IT revolution helped drive a fifth wave in the 1990s and another spurt more recently with digital media and artificial intelligence. These were associated with secular bull markets in the 1920s, the 1950s & 60s, the 1980s & 90s and over the last decade, with the move to lower interest rates and associated speculation also playing big roles in the last two.
At the end of each long-term upswing, share markets reached overvalued extremes and investors had become excessively exposed as optimism that good times would roll on forever reached extremes. This left shares vulnerable as excesses such as too much debt (1930s and 2000s), excessive inflation (1970s) and excessive speculation in tech shares and then housing in the late 1990s and 2000s became overwhelming, giving way to economic weakness and secular bear markets.
The business cycle – this is the best-known economic cycle and has a duration of 3 to 5 years. It tends to relate to the standard economic cycle where after a few years of economic expansion, inflation or other imbalances build up which results in monetary tightening, which leads to a downturn or recession, then falling inflation and monetary easing, which then sets the scene for the next expansion. It tends to underpin a 3 to 5 year cycle in investment markets with the stylised link to share markets, property and government bonds shown in the next chart. Shares tend to lead the business cycle – bottoming several months before an economic trough and vice versa at the top. Property markets tend to be more coincident.
The standard 3 to 5 year investment cycle
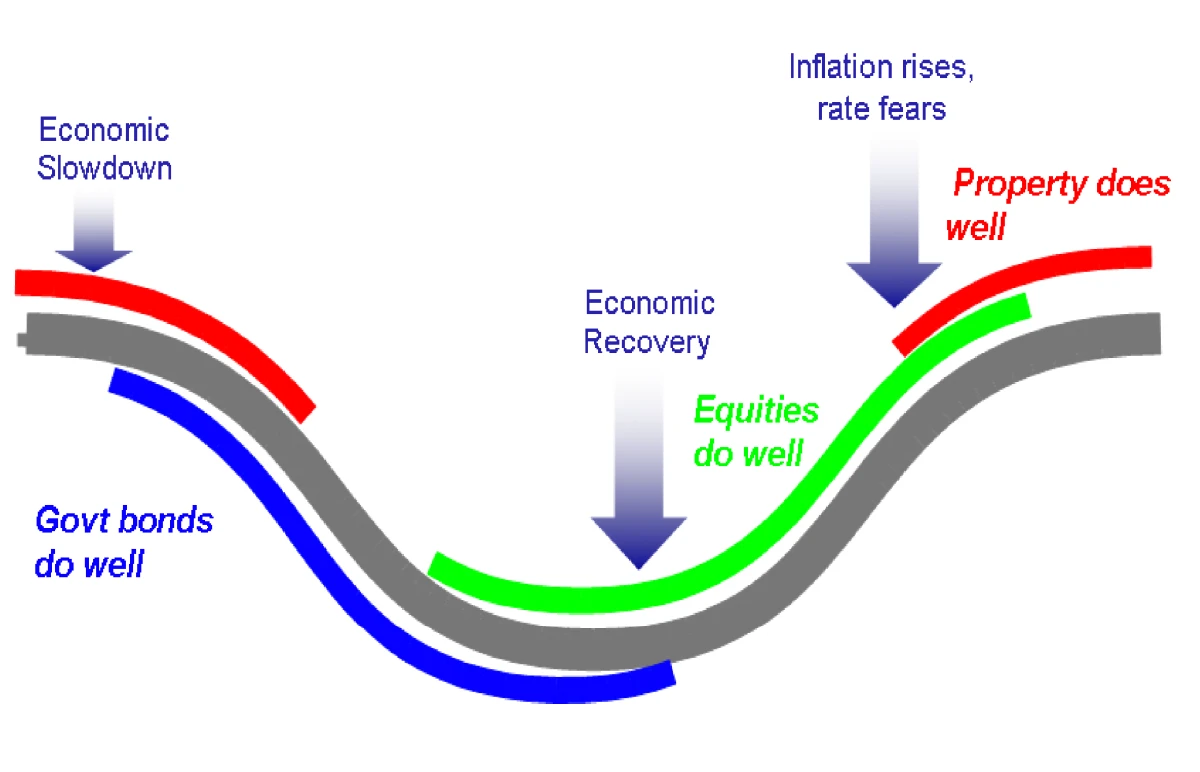
Source: AMP
In terms of actual share market fluctuations, the 3-5 year investment cycle is evident in the swings in rolling 12-month changes in Australian share prices. Periods of poor returns are invariably followed by periods of strong returns (and vice versa) but trying to time this can be very hard. See the next chart.
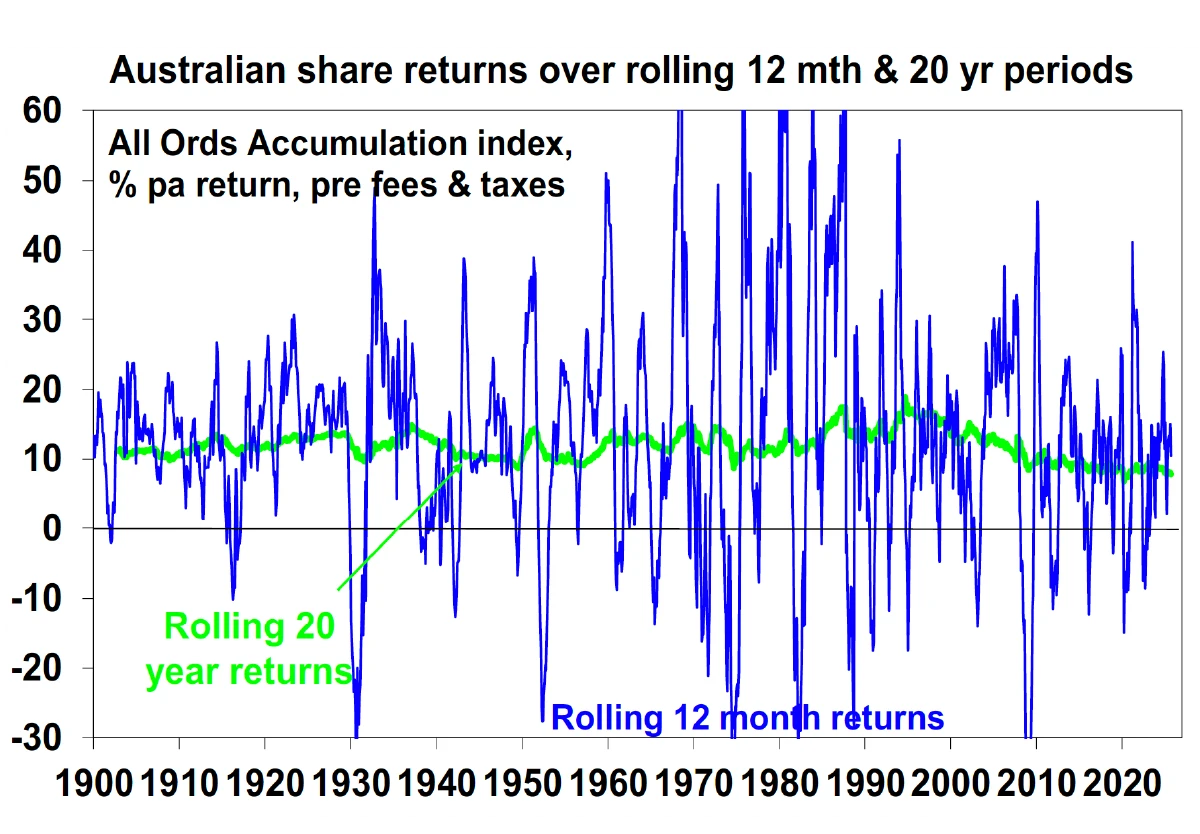
Source: ASX, Bloomberg, AMP
Short term sentiment cycles – within the 3 to 5 year investment cycle there are also short-term swings (weekly, monthly) between overbought and oversold for things like shares and currencies driven by swings in investor sentiment, but which can relate to the tendency for economic data to run through hot and cold periods, particularly relative to market expectations. They can often give rise to corrections in share markets, with say 5 to 20% falls.
Some observations
There are several points to note regarding investment cycles:
- No two cycles are the same and their duration can vary so they don’t operate to precise years, despite claims by some to the contrary. But they do have common features, usually being set off by economic or financial developments and accentuated by swings in investor sentiment which can push them to extremes from which a reversal can occur. As such, while history doesn’t repeat, it rhymes.
- There are cycles within cycles. For example, even though US shares were in long-term secular bear markets in the 1970s and 2000s they still saw periodic cyclical swings in economies and share markets.
- When several cycles combine the impact can be huge. For example, a business cycle downturn in 000 coincided with an end to the secular boom of the 1980s and 1990s and saw 50% falls in global shares in the period 2000 to 2003.
- Despite various attempts to smooth them out (via economic policies and regulation) or declare them dead, cycles live on.
- Cycles can be self-limiting as economic downturns lead to lower inventories, pent up demand and lower interest rates, which sow the seeds of recoveries. Share slumps result in cheap shares which entice bargain hunters and sow the seeds of a new bull market.
- Investment cycles provide opportunities for investors to vary their asset allocation through the cycle, e.g. buying more shares into downturns and cutting exposure into upswings.
- But timing investment cycles is difficult. No one rings the bell at the top or bottom. And given the psychological tendency of individual investors to project recent market moves into the future (referred to as “recency bias”) and find safety in what the crowd of other investors are doing, the main risk is that investors, in seeking to time investment cycles, end up wrong footed by selling after big falls and buying after big gains. So, for most investors it’s important to be aware of cycles and understand that they are normal, but then to take a long-term approach to investing that looks through them and makes the most of the compounding of returns over long periods.
Where are we now?
We are currently in a reasonably positive phase of the 3-5 year investment cycle as inflation has cooled from its 2022 high which has enabled central banks, including the Fed and RBA, to cut rates and provide a boost to economic growth. Sometimes this is referred to as “goldilocks” i.e. not too hot and not too cold. This has been reflected in strong gains in share markets over the last three years. However, President Trump’s tariffs have complicated the normal cyclical pattern by boosting US inflation and depressing employment and imparting downside risks for the US economy. And shares have had three years now of strong returns resulting in stretched valuations particularly with signs that key large cap US stocks, often referred to as the Magnificent Seven (Apple, Microsoft, Alphabet, Meta, Amazon, Nvidia and Tesla), may be becoming a bit bubbly. All of which are warning of a pullback in shares which would not be out of line with their normal volatility as evident in the previous chart, before receiving a further boost from lower interest rates.
While AI developments remain very promising, we may be entering a weaker more constrained phase of the long-term investment cycle reflecting less favourable economic policy and demographic trends which may make the world more inflation prone.
Other cycles of relevance
Seasonal patterns – There is a well-known seasonal pattern in shares that sees strength from November reflecting the ending of US tax loss selling, a wind down in equity raisings, new year cheer and the reinvestment of bonuses which continues after a brief pause around February into mid-year, before weakness from around May to October, particularly in August and September. Right now, we are nearing a seasonally strong period, although it’s a bit complicated by not having seen the normal seasonal weakness in August and September in the US.
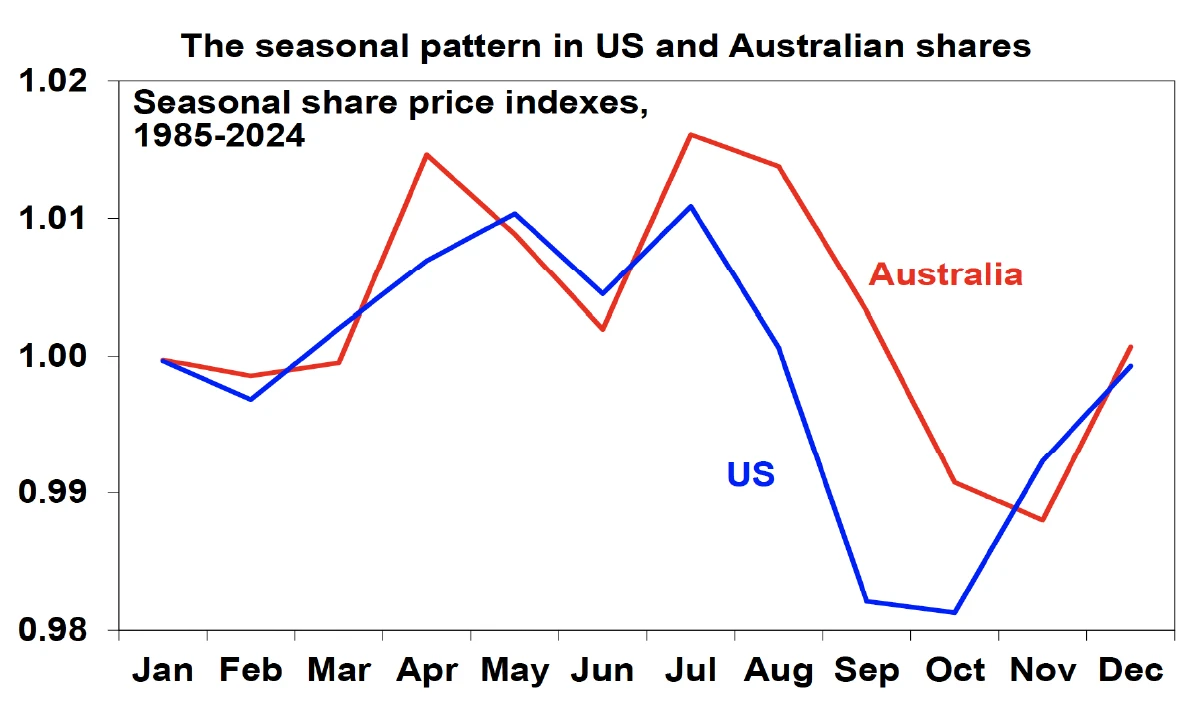
Source: Bloomberg, AMP
Political cycles – these are less relevant in countries with an irregular political cycle like Australia. However, the US has a precise four-year federal political cycle, and this has given rise to a fairly regular pattern. This sees near average share market returns in the first year after a Presidential election, well below average returns in the second (or midterm election) year, but above average returns in the third year (as the President seeks to stimulate the economy), and average returns in the fourth year. In fact, since 1950 the US share market has experienced an average top to bottom fall in the mid-term election year of 17%. So next year could be a bit rougher for US shares and this could flow to Australian shares.
In closing
I have been following investment cycles for about 40 years now, and they can indicate future trends. But I have also learned, more importantly, that trying to time the market is nearly impossible. That’s
why it is so important to have an investment strategy and financial plan in place and regular reviews by your financial planner.
Please call our office on 02 9328 0876 if you need a review or if you have a friend or family member who needs financial advice.
Bill Bracey
CEO & Founder of Sydney Financial Planning
Is your investment strategy prepared for market cycles?
Speak with our Financial Planners about navigating market cycles and protecting your portfolio through economic shifts. To book a meeting get in contact with us on 02 9328 0876.
This article was prepared by Dr Shane Oliver with opening and closing summary by William Bracey – CEO & Senior Financial Planner from Sydney Financial Planning. Dr Shane Oliver who provides economic forecasts and analysis of key variables and issues affecting, or likely to affect, all asset markets. He also provides economic forecasts and analysis of key variables and issues affecting, or likely to affect, all asset markets.
Sydney Financial Planning Pty Ltd (ABN 29 606 413 254), trading as Sydney Financial Planning & Illawarra Financial Planning is an Authorised Representative & Credit Representative of Charter Financial Planning Limited, Australian Financial Services Licensee and Australian Credit Licensee.
This article contains information that is general in nature. It does not take into account the objectives, financial situation or needs of any particular person. You need to consider your financial situation and needs before making any decisions based on this information. If you decide to purchase or vary a financial product, your financial adviser, and other companies within the AMP Group may receive fees and other benefits. The fees will be a dollar amount and/or a percentage of either the premium you pay or the value of your investments. Please contact us if you want more information. If you no longer wish to receive direct marketing from us you may opt out by contacting Sydney Financial Planning . You may still receive direct marketing from AMP as a product issuer, bringing to your attention products, offerings or other information that may be relevant to you. If you no longer wish to receive this information you may opt out by contacting AMP on 1300 157 173.