Reading Time:
Key points
- Overthe long-term Australian shares have been a relatively strong performer, but it does go through relatively long periods of out and underperformance versus global shares.
- We see more upside in Australian shares supported by the return of profit growth. And its underperformance over the last 16 years is getting long in the tooth..
- But rich valuations, a more hawkish RBA and global risks suggest it will be a bumpy ride.
- What happens after the Iran/Middle East attacks?
Introduction
Australian shares have had a strong start to 2026 with the ASX 200 up 3.3% and flirting with a new record high. The local market has also outperformed US shares which are down 0.1% and global shares which are up 1.6%. However, this could just be noise and follows a significant underperformance against US and global shares since 2009. So, can the gains continue and is the 16 year structural underperformance finally over?
Source: Bloomberg, AMP
Australian shares in a long-term context
To get a handle on the future, it’s first useful to understand the past and here some key points on the performance of Australian shares:
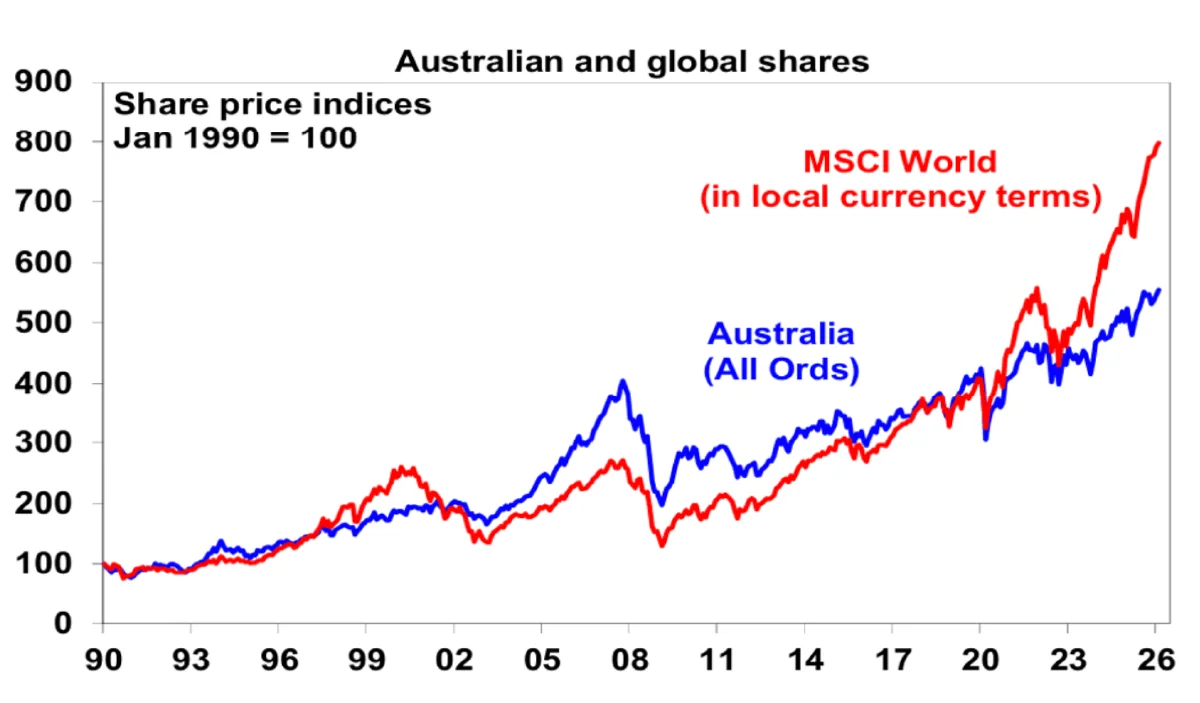
- Over the very long-term Australian shares have been a strong performer. Since 1900 Australian shares have returned 11.6% per annum once dividends are allowed for versus 10.1% pa for US shares.
- However, Australian shares go through periods of relative out & underperformance or “mean reversion”. This can be seen in the next chart. Australian shares outperformed in the 1940s (indicated by a +), unperformed in the 1950s (indicated by a –), outperformed in the 1960s resources boom years, underperformed in the high inflation 1970s and 80s, outperformed in the 1990s (although Australia underperformed in the second half of the 1990s when the tech boom raged), outperformed dramatically in the resources boom of the 2000s and underperformed in the 2010s and this decade so far.
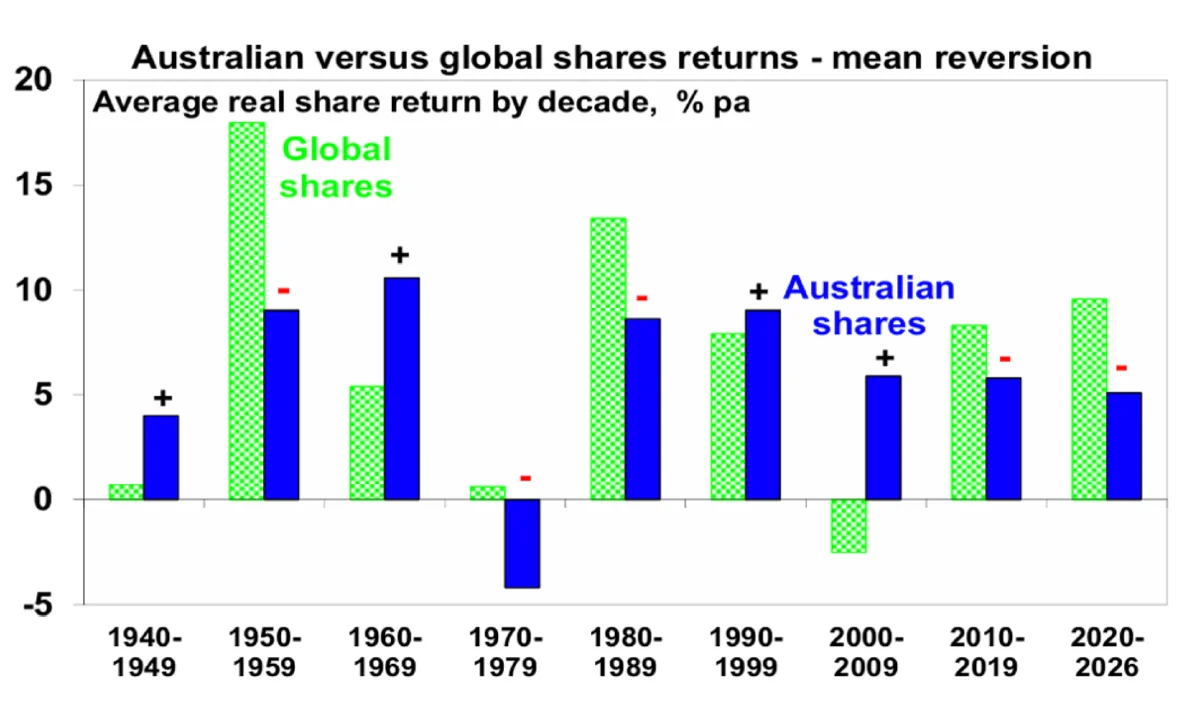
Includes dividends. Source: ABN-Amro Global Investment Returns Yearbook, Bloomberg, AMP
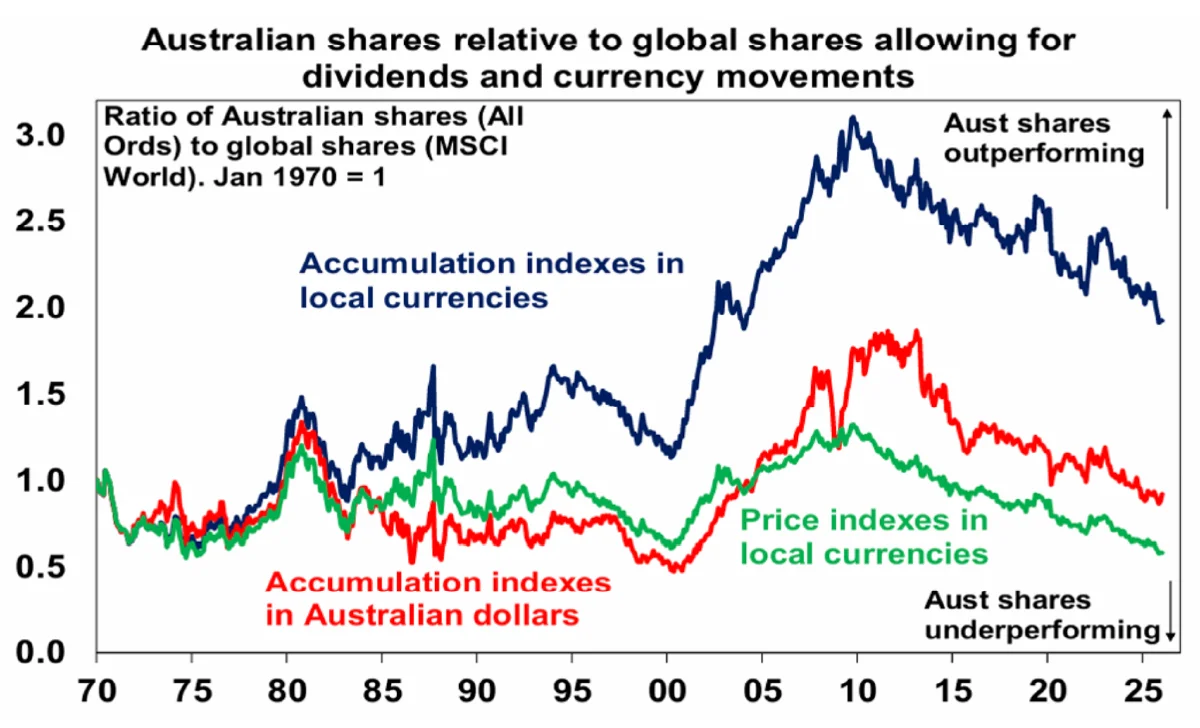
- The more recent swings in relative performance can be seen more starkly in the next chart. It compares the relative performance of Australian to global shares since 1970 in terms of: relative share prices in local currency terms (green line); relative total returns ie with dividends added in (blue line); and relative total returns with global shares in Australian dollars (red line). A rising ratio means Australian outperformance and vice versa.
- As Australian shares pay high dividend yields (3.3% currently) versus global shares (1.5%), dividends should be included in comparisons of Australian & global share returns. So, the focus should be on the blue line (comparing total returns) or the red line which compares total returns in $As, and not the green line which only looks at share prices.
Source: Bloomberg, AMP
Several things stand out.
- First, as noted earlier, over long periods of time and when dividends are allowed for Australian shares have performed well versus global shares. Since 1970 Australian shares have returned (capital growth plus dividends) 10.2% per annum versus 8.9% pa for global shares in local currency terms. However, the falling $A over this period has enhanced the return from global shares to 10.4% pa but its not that different to the return from Australian shares.
- Second, the swings in the relative performance of Australian shares are apparent if dividends and currency moves are allowed for or not.
- Finally, since October 2009, Australian shares have seen a long run of underperformance. Over that period, they have returned 8.5% pa compared to 11.8% pa from global shares in local currencies or 12.9% pa from global shares in Australian dollar terms (as the $A fell).
Why has Australia underperformed since 2009?
The underperformance of Australian shares since 2009 reflects a combination of: payback for the huge mining boom related outperformance of the 2000s; the slump in commodity prices from 2011; the lagged impact of the surge in the $A above parity against the $US into 2011; relatively tighter monetary policy in Australia for much of the post GFC period; fears that higher post pandemic interest rates will hit Australia harder due to more indebted households and Australia’s expensive property market; worries about the slowing Chinese economy; and a low exposure to tech stocks – with tech stocks propelling US shares in the pandemic and more recently with AI excitement.
Five reasons Australia’s underperformance may be at or close to over
There have been several occasions over the last few years where it looked like the relative underperformance of Australian shares may be ending – such as around 2018-19 and 2022 – only to see it resume taking the ratios in the previous chart to new lows for this cycle. But there are now several positives for the Australian share market suggesting at least more upside on a 12 month view and possibly some relative outperformance.
- Mean reversion – the historical experience tells us that after a lengthy period of underperformance the local share market eventually bottoms and outperforms for a few years. This may now be due after more than 16 years of underperformance.
- Rotation from tech to non-tech shares – global investors appear to be rotating away from tech shares on the back of concerns about stretched valuations, excessive capex related to AI and worries that AI will decimate software businesses (ie “tech eating itself”). This will work against the tech heavy US share market (and was evident in the global relative underperformance of US shares last year) and may benefit the Australian share market. As we saw in the tech wreck of 2000-03 Australia’s low tech exposure turned out to positive for Australian shares and helped kick of a long period of outperformance.
- A new super cycle in commodities – the commodity price slump from their 2008-2011 highs looks to be over with commodities embarking on a new super cycle bull market driven by constrained supply after low levels of investment and electrification and rising defence spending driving increased demand for metals. This will benefit Australia’s resource stocks. Iron ore is likely to feature less this time around partly reflecting slowing urbanisation in China and its property slump. But it’s worth noting that copper is now a bigger contributor to BHP’s earnings than iron ore.
- Artificial Intelligence could add to demand for commodities – North American research provider the Bank Credit Analyst has posited that if AI driven robotics effectively boosts the supply of labour and drives a surge in global GDP, then the value of other factors of production like land and natural resources will soar. So, Australia might turn out to be a big long-term beneficiary of the AI revolution.
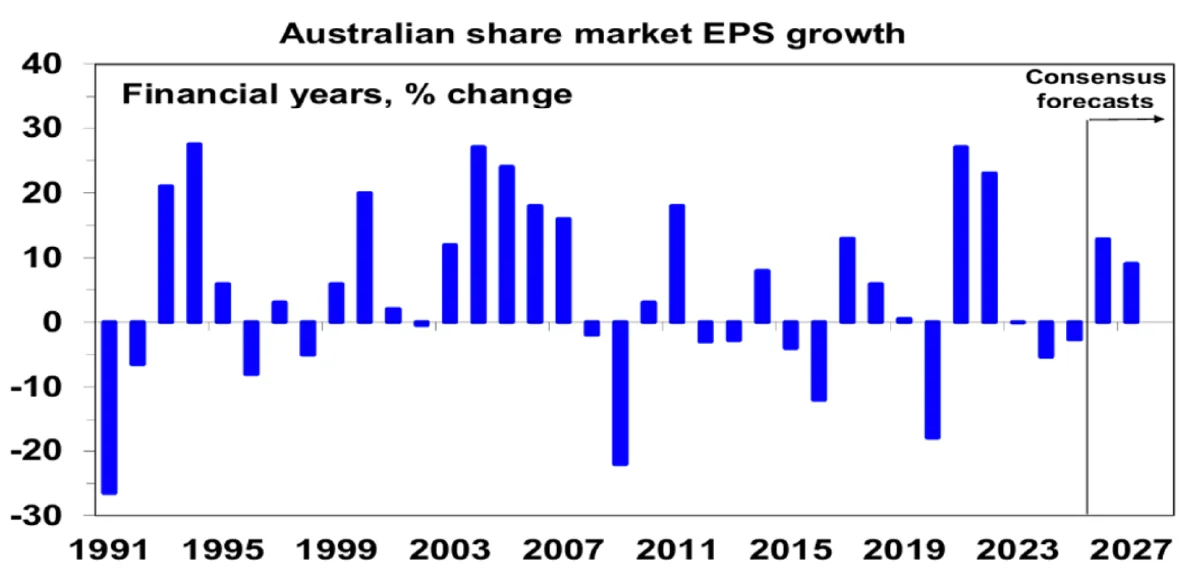
- Company profits are rising again in Australia – this is the key driver in the near term. After three years of falls listed company profits are turning up with the latest profits reporting season confirming this: upside surprises have been surpassing downside surprises by almost two to one which is the strongest since 2021 and more companies are reporting profits and dividends up on a year ago compared to what was occurring in 2023 and 2024.
What happens now, after the Iran/Middle East attacks?
The risks
Oil and gas prices rise, leading to higher inflation worldwide, followed by higher interest rates globally. This generally results in slower economic growth around the world. Hopefully, this is a short, sharp event, and Iran is free and able to rebuild its economy and develop friendly relationships with its trading partners. In that case, oil prices would fall, inflation would ease, and economies would grow.
However, if the conflict were to escalate into a prolonged war, it would place significant strain on the global economy.
The upside
The upside is that tensions in the Middle East ease, stability returns, oil prices fall, interest rates come down, and global economic growth strengthens.

Source: Bloomberg, AMP
Consensus earnings expectations for this year have risen to 13%.
Source: UBS, Bloomberg, AMP
But it’s unlikely to be smooth sailing
There are three key threats or constraints for Australian shares:
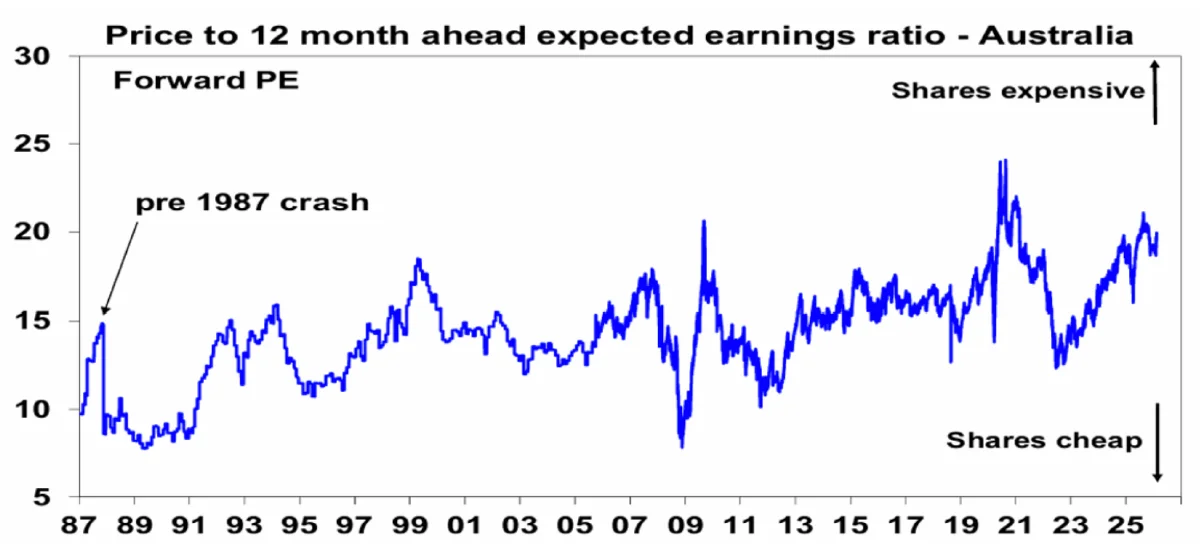
- Valuations are rich with the forward PE of 20 times well above its norm of 15 times and the absence of a risk premium over bonds.
- The RBA’s hawkish bias with the high risk of more rate hikes could threaten the Australian economic and profit growth outlook.
Source: Bloomberg, AMP
- Global uncertainty around tech shares, US policies and geopolitics. As we have seen in the past, big ructions in US tech shares can have a flow on to Australian shares even if we have a low exposure to tech stocks. While the US Supreme Court has provided confidence that legal constraints remain on President Trump and Trump is now more politically constrained with the midterms this year, his replacement tariff strategy has ramped up the uncertainty around US trade policy. Finally, the high probability of another US strike on Iran risks a spike in oil prices should Iran decide to be uncooperative.
In closing
Being an avid share investor for over 50 years and a financial planner for almost 40 years, I’ve learnt that trying to predict investment returns short-term is a guess at best. But what I know with great certainty is what investment returns will be over the medium to long term, as long as you are well-diversified and your portfolio is well managed and aligned with your goals. The outlook for Australian shares remains positive. As good companies keep increasing their profits, the share market goes up. When the market underperforms, it represents better value. I never like paying full price! We will see what happens with AI stocks getting way overvalued; they have come back to earth at some point. Uncertainty always affects valuations. COVID was a good example; the ASX is now 71% higher than in March 2020, and that doesn’t include dividends.
It will be a bumpy ride forward, but if you build this into a broader portfolio of assets advised by Sydney Financial Planning, the benefits are clear. It’s easy for me to look back as I’ve been doing this for a long time – helping clients build wealth and live a better life, so I have greater wisdom and a grey hair to match.
Bill Bracey
CEO & Founder of Sydney Financial Planning
Want to maximise your Australian share opportunities?
Speak with our Financial Planners about optimising your Australian equity exposure for 2026 and beyond. To book a meeting get in contact with us on 02 9328 0876.
This article was prepared by Dr Shane Oliver with opening and closing summary by William Bracey – CEO & Senior Financial Planner from Sydney Financial Planning. Dr Shane Oliver who provides economic forecasts and analysis of key variables and issues affecting, or likely to affect, all asset markets. He also provides economic forecasts and analysis of key variables and issues affecting, or likely to affect, all asset markets.
Sydney Financial Planning Pty Ltd (ABN 29 606 413 254), trading as Sydney Financial Planning & Illawarra Financial Planning is an Authorised Representative & Credit Representative of Charter Financial Planning Limited, Australian Financial Services Licensee and Australian Credit Licensee.
This article contains information that is general in nature. It does not take into account the objectives, financial situation or needs of any particular person. You need to consider your financial situation and needs before making any decisions based on this information. If you decide to purchase or vary a financial product, your financial adviser, and other companies within the AMP Group may receive fees and other benefits. The fees will be a dollar amount and/or a percentage of either the premium you pay or the value of your investments. Please contact us if you want more information. If you no longer wish to receive direct marketing from us you may opt out by contacting Sydney Financial Planning . You may still receive direct marketing from AMP as a product issuer, bringing to your attention products, offerings or other information that may be relevant to you. If you no longer wish to receive this information you may opt out by contacting AMP on 1300 157 173.