
Tag: Australian Economy

August Economic Update 2020

Bill Bracey, the Principal and Senior Financial Planner at Sydney Financial Planning looks at a few statistics on what has happened with the economy so far and gives his insights into what’s to come.

Bill also shares with us his experience over the years supporting his clients who have come out on top because they have a financial plan for the long-term.


If you would like to speak with Bill and the team about your financial plan…

Get in touch to either book a virtual meeting or call us on 02 9328 0876.


Video by SFP – Bill Bracey | Senior Financial Planner


General Disclaimer: This article contains information that is general in nature. It does not take into account the objectives, financial situation or needs of any particular person. You need to consider your financial situation and needs before making any decisions based on this information. Please seek personal financial advice prior to acting on this information.


2019-20 Investment market reflections

2019-20 saw poor returns

2019-20 Investment market reflections

  • Key lessons for investors from the last financial year were to: maintain a well-diversified portfolio; timing market moves is hard; beware the crowd; turn down the noise; and don’t fight the Fed.
  • With coronavirus risks still high, investment markets may see more short-term volatility. But over the next 12 months returns from a well-diversified portfolio are likely to be constrained, but okay.

Introduction

The past financial year was poor for investors as coronavirus knocked economies into what is likely to be their biggest hit since the 1930s. Shares were hit hard, but the blow was softened by a strong rebound in the June quarter. This note reviews the last financial year and takes a look at the outlook.

Pre and post covid

The past financial year can effectively be divided into two halves. The period from July last year into early this year saw generally strong returns from shares and growth assets, as fear of recession faded helped by central bank easing and a truce in the US/China trade war and gave way to expectations of some improvement in global economic growth. Despite devastating bushfires and a subdued growth outlook even the Australian share market made it to a record high in February. Against this backdrop, returns from government bonds were subdued.

This now seems like it was a different world as it all started to fade and ultimately reverse as the coronavirus epidemic started to become a problem in China in January. Initially it was hoped it would be contained to China (which successfully controlled it allowing a reopening of its economy from March) but from late February the number of cases escalated in Europe then the US, Australia and ultimately emerging countries, resulting in severe lockdowns driving sharp economic contractions in economic activity. So, between 20th February and 23rd March share markets collapsed by around 35% dragging down commodity prices. This also saw the $US surge and the Australian dollar plunge to around $US0.55.

However, from late March shares staged a rebound driven by policy stimulus, a decline in new covid cases, economic reopening and a rebound in economic data. From their March lows to June highs global shares rose 40% & Australian shares rose 35% and commodity prices and the $A also rebounded.

So, despite this wild ride, for the financial year as a whole global shares returned 5.2% in Australian dollar terms. This was led by the US share market which outperformed due to a heavy tech and health care exposure, a relatively low exposure to cyclical shares and massive Fed quantitative easing. Australian shares didn’t fare so well & still lost 7.7% for the financial year.

Cash and bank deposits had very low returns as the RBA cut the cash rate to 0.25% in March. But bonds had reasonable returns as plunging yields provided capital growth for investors. Despite the plunge in interest rates and bond yields, listed property saw double digit losses as the coronavirus driven slump in economic activity pushed up vacancies and depressed rents in retail and office properties. Returns on airports were similarly depressed weighing on direct infrastructure returns.

This all saw small negative returns for balanced growth superannuation funds of around -1.5% after fees and taxes. Of course, it would have been much worse were it not for the June quarter rebound in shares. The hit to super returns also followed several years of strong returns and the five-year average is just over 5% which is not so bad given (pre tax) bank deposit rates averaged around 2% and inflation averaged 1.5%.

2019-20 major asset class returns

Source: Thomson Reuters, AMP Capital

Like shares, Australian residential property had a roller coaster ride – first rising 10% on rate cuts and the Federal election before starting to slow as coronavirus hit.

Key lessons for investors from the last financial year

These include:

  • Maintain a well-diversified portfolio – while shares and listed property had a rough ride, bonds and exposure to global shares and foreign currency provided some stability. 
  • Timing markets is hard – while it always looks easy in hindsight, getting out in February at the top and then getting back in March at the low would have been very hard to time.
  • Beware the crowd at extremes – as is often the case shares hit bottom in March at a time of extreme investor pessimism.
  • Turn down the noise – the noise around coronavirus is at fever pitch making it very hard to maintain focus on long term investing, so the best thing is to turn it down a notch. 
  • Don’t fight the Fed – despite near zero interest rates and high public debt levels, policy stimulus can still be applied on a massive scale and still impacts investment markets.

The negatives

There are a bunch of threats which are likely to lead to a further correction in shares in the short term, ongoing bouts of volatility and constrained returns. Here are the big ones.

  • First, while some countries have got new coronavirus cases well down, it’s still on the rise globally particularly in emerging countries and the US and Victoria have seen a resurgence in cases. This is threatening a return to economically debilitating country wide lockdowns (as opposed to targeted measures). Even partial lockdowns will slow the recovery – eg, our rough estimate is that the new six-week lockdown of Melbourne, which accounts for about 20% of Australian GDP will knock nearly 1% off Australian GDP this quarter, which will slow the recovery (but not derail it as it should be offset by growth in other states). 
  • Second, the shutdowns will leave lasting collateral damage in terms of bankruptcies and higher unemployment as the embrace of technology has been sped up, companies cut costs and skills atrophy, all of which will weigh on growth.
  • Third, in Australia the main collateral risk is that the combination of high unemployment, a collapse in underlying housing demand on the back of a plunge in immigration and a depressed rental market drive a sharp collapse in home prices triggering negative wealth effects.
  • Fourth, the run up to the US election has the potential to drive increased share market volatility if it looks increasingly likely that Biden will win and raise taxes, and the risk is probably greater if President Trump decides he has nothing to lose and ramps up tensions with China and maybe Europe. With betting markets favouring a clean sweep by the Democrats some of the former is probably already priced, but an intensification of trade wars is probably not.
  • Finally, shares are expensive on traditional metrics like PEs.

The positives

However, there are a bunch of positives providing an offset.

  • First, several Asian countries have shown its possible to control the virus – notably China, South Korea, Taiwan and Japan. Maybe the SARS experience helps along with the culture of wearing masks. Surely, we can learn from them.
  • Second, progress is continuing to be made in terms of vaccines and treatments for coronavirus. I am a bit sceptical about a vaccine, but the latter may be contributing to lower death rates. If deaths remain low compared to the first wave there is less risk of a return to hard lockdowns (Victoria excepted!) and less self-isolation.
  • Third, policy makers remain committed to do whatever they can to support businesses, incomes and jobs with record levels of fiscal stimulus relative to GDP and massive monetary stimulus. This is different to normal recessions where it takes longer for policy makers to swing into action. To this end policy stimulus will be extended in the US and in Australia (with the Treasurer talking about another phase of income support and possibly bringing forward tax cuts). 
  • Fourth, a range of economic indicators have seen a Deep V rebound from shutdown lows starting in China and then in developed countries, suggesting significant pent up demand. This is most evident in business conditions PMIs but also in retail sales. On balance we see a gradual bumpy economic recovery from here. Australian GDP is expected to contract -4.5% this year and grow 4% next year.

2019 20 global manufactiring and service pmi

Source: Bloomberg, AMP Capital

019 20 aus shares yeild vs bank deposits

Source: RBA; AMP Capital

  • Finally, the plunge in interest rates and bond yields have increased the present value of shares and other growth assets, which explains why price to earnings multiples are so high. Or looked at another way, shares remain attractive despite lower earnings and dividends because the alternatives like bank deposit rates are even less attractive.

What about the return outlook?

With coronavirus risks still high, investment markets may see more volatility. But over the next 12 months returns from a well-diversified portfolio are likely to be constrained but okay.

  • After a strong rally from March lows shares remain vulnerable to short term setbacks given uncertainties around coronavirus and US/China tensions. But on a 6 to 12-month view shares are expected to see reasonable returns helped by a pick-up in economic activity & massive policy stimulus. 
  • Cash and bank deposit returns are likely to be poor at less than 1% as the RBA is expected to keep the cash rate at 0.25%. Investors still need to think about what they really want: if it’s capital stability then stick with cash, but if it’s a decent income flow then consider the alternatives. 
  • Low starting point yields are likely to result in low returns from bonds once the dust settles from coronavirus.
  • Unlisted commercial property and infrastructure are ultimately likely to benefit from a resumption of the search for yield, but the hit to economic activity and hence rents from the virus will weigh heavily on near term returns. 
  • Home prices are expected to fall by around 5 to 10% into next year as higher unemployment, a stop to immigration and the weak rental market impact.
  • Although the $A is vulnerable to bouts of uncertainty about the global recovery and US/China tensions, a continuing rising trend is likely if the threat from coronavirus recedes.

Loans and guarantees are helpful but they leave businesses more indebted, whereas actual fiscal stimulus provides a direct boost. So actual fiscal support is a better measure and on this front Australia at 10.6% of GDP has provided by far the strongest fiscal stimulus of G20 countries. What’s more, Australia’s centrepiece JobKeeper wage subsidy is superior to approaches taken by many other countries as it keeps people “employed”, minimises confidence zapping negative headlines around unemployment, preserves the employer/employee relationship, keeps workers getting paid and provides a subsidy to struggling businesses. Unemployment is likely to rise to around 10% which is bad, but its far better than the 15% that would likely occur in the absence of JobKeeper or 20% or so unemployment in the US.

Things to keep an eye on

The key things to keep an eye on are: coronavirus hospitalisations and deaths, as a guide to the degree of isolation; global business conditions PMIs and unemployment; US election prospects; and Australian house prices.


Get help making sure your investment strategies that can ride the storm…

Speak with one of our Financial Planners, we’re here to help, either book a virtual meeting or get in contact with us on 02 9328 0876.


Article by AMP Capital


This article was prepared by Dr Shane Oliver. Dr Shane Oliver who provides economic forecasts and analysis of key variables and issues affecting, or likely to affect, all asset markets. He also provides economic forecasts and analysis of key variables and issues affecting, or likely to affect, all asset markets.

Important note: While every care has been taken in the preparation of this document, AMP Capital Investors Limited (ABN 59 001 777 591, AFSL 232497) and AMP Capital Funds Management Limited (ABN 15 159 557 721, AFSL 426455) make no representations or warranties as to the accuracy or completeness of any statement in it including, without limitation, any forecasts. Past performance is not a reliable indicator of future performance. This document has been prepared for the purpose of providing general information, without taking account of any particular investor’s objectives, financial situation or needs. An investor should, before making any investment decisions, consider the appropriateness of the information in this document, and seek professional advice, having regard to the investor’s objectives, financial situation and needs. This document is solely for the use of the party to whom it is provided.

General Disclaimer: This article contains information that is general in nature. It does not take into account the objectives, financial situation or needs of any particular person. You need to consider your financial situation and needs before making any decisions based on this information. Please seek personal financial advice prior to acting on this information.

Australia the lucky country

The lucky country…

Australia the lucky country

  • If, as a we expect, this results in a relatively stronger recovery for the Australian economy, then Australian assets should benefit relative to global assets.
  • Introduction

    Back in January when the bushfires were raging, I feared Australia’s luck had ran out. But right now, I thank god I live in The Lucky Country! Donald Horne’s original conception of the term in the 1964 book of the same name about Australia being run by “second rate people who share its luck” always seemed a bit too negative to me. Sometimes it may seem that way for a patch and yes mistakes are made, but when it really matters, I reckon we are led pretty well. Particularly in times of crisis. Think the 1980s when Hawke and Keating opened up and modernised the economy. Or through the GFC when a rapid policy response was a big reason Australia avoided recession. The response to the current crisis will likely also go down as a time when Australia rose to the occasion.

    Of course, we are still not out of the woods on coronavirus and there are some bad stats ahead on the economy. This is indicated by our Australian Economic Activity Tracker which is based on high frequency alternative data and is running down 40% on year ago levels, reflecting a preponderance of components most affected by the shutdown.

    Australian economic activity tracker

    Source: Bloomberg, AMP Capital

    The good news is that it is up from its early April low, but there is still bad news ahead of us in the official statistics. Unemployment likely spiked to around 10% last month which is the highest since the 20% seen during the Great Depression and official data to be released in the months ahead is likely to reflect a 10 to 15% contraction in the economy in the first half of the year, all of which risks further depressing confidence.

    But three things suggest Australia looks likely to come through this period of global misery relatively well compared to many other countries and this may mean the Australian economy contracts less and rebounds faster, ultimately supporting Australian asset classes relative to other countries’ assets.

    First, Australia has performed better than many countries in controlling coronavirus

    While things were bleak in late March, Australia’s success in “controlling” coronavirus (touch wood) stands out globally. After a rapid escalation in new cases, Australia imposed a shutdown around 22 March. New cases peaked in late March at over 500 a day and have since declined to less than 30 a day, albeit with a few clusters still causing problems. New cases may have peaked in the US but are still averaging around 29,000 per day.

    Comparing OECD countries in how they are managing the coronavirus outbreak (based on recovery rates, active cases per capita, total cases per capita adjusted for the number of days since the first case and testing per capita) Australia ranks first, with NZ 2nd (guess where your next overseas holiday might be!) compared to Italy at 28th, the UK at 31st, Sweden at 36th and the US the worst performer in the OECD at 37th.

    Comparing OECD countries

    Source:Worldometer, AMP Capital

    Better weather, less congested living, a younger population and luck may have played a role, but the big driver looks to have been a public health response driven by expert medical advice as opposed to bravado or crackpot theories. And this has been backed up by Australians pulling together to do the right thing. By contrast Europe and the US have been marked by a slower response (eg lockdowns in Italy and Spain did not occur until new cases per million people were around 30, compared to around 12 in Australia). And Australia has achieved a similar virus outcome with a less stringent lockdown to New Zealand.

    Australia’s better record in containing the virus means two things. First, it has kept pressure off the health system so those who need hospitalisation can get it. As a result, Australia has managed to do a much better job of saving its own people than many other countries. Deaths per million people are around 3.9 in Australia, compared to 84 in Germany, 221 in the US, 280 in Sweden, 443 in the UK and 485 in Italy – that’s 124 times worse than Australia’s death rate! The value of saved lives swamps the cost to the economy from the shutdown.

    Coronavirus per million

    Source: Worldometer, AMP Capital

    It also provides Australia more scope to open the economy sooner and with greater confidence that a “second wave” of cases will be avoided – in contrast to the US where there is no clear downtrend in new cases. Indications from the Government are that a phased easing of the shutdown looks on track to start this month with most businesses running again by July.

    Second, Australia has seen a superior policy response

    Australian fiscal response g20

    Source: IMF, AMP Capital

    The global government policy response to the economic threat posed by coronavirus shutdowns has been huge. See the next chart. However, in many countries it includes a large element of loans and debt guarantees as opposed to actual fiscal stimulus in the form of spending or tax cuts. For example, providing a loan (or a guarantee to enable a loan) to a business to help it survive the shutdown versus providing it with a wage subsidy.

    Loans and guarantees are helpful but they leave businesses more indebted, whereas actual fiscal stimulus provides a direct boost. So actual fiscal support is a better measure and on this front Australia at 10.6% of GDP has provided by far the strongest fiscal stimulus of G20 countries. What’s more, Australia’s centrepiece JobKeeper wage subsidy is superior to approaches taken by many other countries as it keeps people “employed”, minimises confidence zapping negative headlines around unemployment, preserves the employer/employee relationship, keeps workers getting paid and provides a subsidy to struggling businesses. Unemployment is likely to rise to around 10% which is bad, but its far better than the 15% that would likely occur in the absence of JobKeeper or 20% or so unemployment in the US.

    Third, Australia’s major trading partner is 2-3 months ahead of the rest of the world

    Finally, we may benefit from our biggest export market – China, which takes a third of our exports – being ahead of the global recovery curve by around 2-3 months and focused on infrastructure spending. This explains why prices for our key export – iron ore – are holding up relatively well compared to say the price of oil (of which we are a net importer).

    Implications for the Australian economy

    If, as appears likely, a phased easing of the lockdown starts this month, then April should prove to be the low point in economic activity and growth should return to the economy in the second half. This does not mean that things will quickly bounce back to “normal” – the easing of the lockdown will likely be gradual to minimise the risk of a “second wave”, some businesses will not reopen, uncertainty will linger, debt levels will be higher and business models will have to adapt to different ways of doing things. This may mean returning to the office on a rotational basis and shops & restaurants reopening but with distancing rules. Domestic travel may be back withing a few months, but international travel looks unlikely in the absence of a vaccine until next year (except to NZ). But it will still see a return to growth, albeit it may not be until end next year before economic activity returns to pre-virus levels.

    The combination of better success in controlling the virus with less risk of a second wave, better protection of the economy with a stronger policy response and Australia’s exposure to China make it likely that the Australian economy will contract less and recover faster than other comparable countries.

    While many fret that without tourism and immigration Australia can’t recover, this is not true. The travel ban has only accounted for a small part of the hit to the economy. Australia actually has a tourism trade deficit of 1% of GDP (we lose more from Australians going overseas than we gain from foreigners coming here) so a ban on international travel will actually boost GDP. However, we do have a 2% trade surplus in education, and this would be lost if foreign students can’t come. Similarly, immigration contributes just less than 1% to economic growth each year in Australia. However, this is all dwarfed by the 10 to 15% hit to economic activity which has mostly come from the domestic shutdown. And it could be argued that a workable testing and quarantine requirement could be introduced to allow students and immigrants to return on a 6-9 month timeframe.

    Risks to watch

    The main risks to watch for are: a “second wave” of coronavirus cases driving a new shutdown beyond the six month protection out to September provided by JobKeeper, increased JobSeeker and the bank debt payment holiday; the lockdown triggering a house price crash resulting in severe second round effects on the Australian economy – this is probably a much greater risk if the lockdown continues beyond September; and political tensions around the origin of Covid 19 damaging Australia’s trade relationship with China in some way.

    Concluding Comment

    It’s a great time to live in Australia. If we can control the spread of the virus, get our economy going before other trade competitors, and get as many people as we can back to work – our economy should right itself. The Chinese economy is recovering, and we can also benefit from that as we export our raw materials to China. Some positive news finally!


    Bill and the team at SFP.


    Get help making sure your investment strategies that can ride the storm…

    Speak with one of our Financial Planners, we’re here to help, either book a virtual meeting of get in contact with us on 02 9328 0876.


    This article was prepared by Dr Shane Oliver. Dr Shane Oliver who provides economic forecasts and analysis of key variables and issues affecting, or likely to affect, all asset markets. He also provides economic forecasts and analysis of key variables and issues affecting, or likely to affect, all asset markets.

    Important note: While every care has been taken in the preparation of this document, AMP Capital Investors Limited (ABN 59 001 777 591, AFSL 232497) and AMP Capital Funds Management Limited (ABN 15 159 557 721, AFSL 426455) make no representations or warranties as to the accuracy or completeness of any statement in it including, without limitation, any forecasts. Past performance is not a reliable indicator of future performance. This document has been prepared for the purpose of providing general information, without taking account of any particular investor’s objectives, financial situation or needs. An investor should, before making any investment decisions, consider the appropriateness of the information in this document, and seek professional advice, having regard to the investor’s objectives, financial situation and needs. This document is solely for the use of the party to whom it is provided.

    General Disclaimer: This article contains information that is general in nature. It does not take into account the objectives, financial situation or needs of any particular person. You need to consider your financial situation and needs before making any decisions based on this information. Please seek personal financial advice prior to acting on this information.

    How deep will Australia’s recession be?

    How deep will Australia’s recession be…

    How deep will Australia’s recession be?

    Introduction

    This is our 4th update since the COVID-19 crisis started. The feedback we are getting is that our SFP insights have been very welcomed, and they have represented a voice of reason in an ocean of fear. Sydney Financial Planning has been operating for 31 years. In 1991 during the recession we had to have, we were there to help guide our clients through this tough period. In 1991, 2001, 2008 and again today in 2020 when the financial markets fell dramatically, we continue to be here for you, guiding and advising you through a rough patch.

    Is this normal?

    Looking forward, is this just a normal recession we will go through or is it worse and deeper? Or is it short-lived? Will we get back to normal quickly? When will the financial markets return to normal?

    At the time of penning this article, the Australian Share Market has staged a
    staggering 20% recovery. So, congratulations to all our clients who did not panic. Congratulations to our clients who took our advice, and took advantage of this fantastic opportunity to buy in at a 40% discount.

    A great proportion of the working population has never known a recession in Australia, and others will be haunted by the last in the early 1990s. This time around, I think Australia is in for a different experience to what we’ve seen and known before – and that’s not entirely a bad thing.

    The Australian government has, rightly, sacrificed economic activity in the name of health in response to the COVID-19 crisis. It’s not alone in this, as you’d well know, major economies worldwide have done and are doing the same thing, albeit in different ways.

    An unfortunate victim in this is Australia’s almost 30-year run of economic growth as we are experiencing our first recession since 1991. The March quarter is most likely going to be negative, and the June quarter will see a big hit to economic activity thanks to the
    virus-driven shutdowns, possibly in the order of 10 percent. In other words, our economy will shrink considerably as this virus runs its course.

    Again, Australia won’t be alone in this, a global recession is likely as major powerhouses like the US and China factor in the huge economic hit of social distancing, isolation measures, and a virtual shutdown of regular activities, businesses, and services that are not essential.

    How will this affect me?

    There is a range of factors Australians will feel as we move through the recession period, and a big one will be how tough the jobs market is. There will be much higher unemployment, it will be harder to switch jobs, and it’s reasonable to expect more redundancies and terminations as the crisis continues.

    This leads to a loss in income and falling wages, which reduces the spending power of affected Australians. Compounding that, even for those who are holding on to their jobs, uncertainty will rise – people worry about the future, they worry about their income, they worry about their employment prospects. That will impact spending patterns, and how much people are willing to part with beyond the essentials.

    It’s worth pointing out some of the potential opportunities for our investors who are prepared to take a long-term view. For one, interest rates will be lower, the official cash rate is currently sitting at the all-time low of 0.25%. This will mean it’s cheaper to service a mortgage.

    The residential property market is also likely to take a hit, which could provide lower entry points for people who have struggled – particularly in cities like Sydney and Melbourne – with affordability. The same logic applies to shares. Although the market is currently more volatile, for those with a long-term outlook, there are opportunities to find value at a lower price point. This especially applies to all those reinvested dividends, if you’re in the accumulation stage.

    Finally, what we think will be different about the recession before us and those Australia has seen before, is that the current crisis is not the result of a bust after a boom. This is an enforced shutdown and a significant disruption – it was not caused by anything fundamental in the Australian economy. Because of that, we are positive that once the virus is under control, we can recover and reach a more normal functioning in a quicker way than we have before. Adding confidence to this is that government and financial support programs – notably the wage subsidy and debt payment holidays – have been applied early and aggressively and should help protect many businesses and individuals so that the economy can bounce back reasonably quickly once the virus is under control.

    Stay the course and keep healthy. This too shall pass.


    Advice team of Sydney Financial Planning


    Remember we are available to help you during this unprecedented time…

    If you have ANY questions please get in touch to speak with one of our Financial Planners we’re here to help, either book a virtual meeting of get in contact with us on 02 9328 0876.


    Article by Michal Bodi | Senior Financial Planner


    General Disclaimer: This article contains information that is general in nature. It does not take into account the objectives, financial situation or needs of any particular person. You need to consider your financial situation and needs before making any decisions based on this information. Please seek personal financial advice prior to acting on this information.

    Photo by Casey Horner on Unsplash


    Acessing superannuation in Coronavirus Crisis

    Thinking of accessing your super due to coronavirus crisis?

    Acessing superannuation in Coronavirus Crisis

    There are two opportunities to access super:

    Up to $10,000 before 1/7/2020 AND up to additional $10,000 between 1/7/2020 – 24/9/2020

    • One application permitted in each period
    • Applications are available from 20th April 2020
    • Withdrawals will be tax free. No impact on Centrelink.
    • Don’t contact your super directly, the applications must be done online via MyGov account (or by phone to ATO)
    • Make sure you have set up MyGov account
    • You will be able to self-assess for faster processing
    • Your ATO MyGov account will display all super in your name – you can elect to claim a portion from each account (say $5K from one and $5K from other)
    • If you’re rejected, you’ll be notified in 2-3 days
    • No timeframe set for when money will be released BUT
    • Normal ID requirements are waived for fast approvals (government intention).

    Who is eligible?

    • If you’ve been unemployed or eligible to receive Jobseeker Payment, equivalent Youth Allowance, Parenting Payment, Special Benefit or Farm Household Allowance, or
    • On or after 1 January 2020, you’ve been made redundant; or had your working hours reduced by 20% or more; or as a sole trader your business was suspended or turnover decreased by at least 20%.

    Other important information:

    • Due to current market downturn, you’re likely to crystallise loses in your account
    • You can always contribute the amount back to super if not used (subject to usual contribution caps)
    • Notice of Intent (NOI) to claim tax deduction for the year needs to be send to your super before withdrawal
    • Once you receive money, consider keeping withdrawn funds in a suitable account (e.g. offset account)
    • Check your insurance benefits and premiums payable, otherwise you can lose your cover.


    Remember we are available to help you during this unprecedented time…

    If you have ANY please get in touch to speak with one of our Financial Planners we’re here to help, either book a virtual meeting of get in contact with us on 02 9328 0876.


    Article by Michal Bodi | Senior Financial Planner


    General Disclaimer: This article contains information that is general in nature. It does not take into account the objectives, financial situation or needs of any particular person. You need to consider your financial situation and needs before making any decisions based on this information. Please seek personal financial advice prior to acting on this information.

    Photo by Diego PH on Unsplash

    Coronavirus - Recession, Depression or Economic Hit?

    Is coronavirus driving a recession, depression or an economic hit like no other?

    Coronavirus - Recession, Depression or Economic Hit?

  • There are big differences between the current disruption to economic activity – which could be very deep in the short term – and past recessions and depressions.
  • Introduction

    Global and Australian shares have fallen well beyond the 20% decline commonly used to delineate a bear market. From their highs to their recent lows major share markets have had roughly 35% falls as investors have moved to factor in a big hit to growth from coronavirus shutdowns.

    Recession now looks inevitable and they tend to be associated with deep and long bear markets, but now there is even talk of depression suggesting an even deeper bear market. In reality, there are big differences now compared to past recessions and the Great Depression, so it really looks like an economic hit like no other with very different implications for the bear market in shares. But let’s first look at past bear markets as they provide some lessons for investors regardless of the cause.

    The two bears – gummy & grizzly

    There are 2 types of bear markets in shares:

    • “gummy” bear markets with falls around 20% meeting the technical definition many apply for a bear market but where a year after falling 20% the market is up (like in 1998 in the US, 2011 and 2015-16 for Australian & global shares); and
    • “grizzly” bear markets where falls are a lot deeper and usually longer lived (like in 1973-74, US and global shares through the tech wreck or the GFC).

    I can’t claim the terms “gummy bear” and “grizzly bear” as I first saw them applied by stockbroker Credit Suisse a few years ago. But they are a good way to conceptualise bear markets. Grizzly bears maul investors but gummy bears eventually leave a nicer taste (like the lollies!). The next table takes a closer look at bear markets. It shows conventionally defined bear markets in Australian shares since 1900 – where a bear market is a 20% decline that is not fully reversed within 12 months. The first column shows bear markets, the second shows the duration of their falls and the third shows the size of the falls. The fourth shows the percentage change in share prices 12 months after the initial 20% decline. The final column shows the size of the rebound over the first 12 months from the low.

    bear markets au shares since 1900

    Based on the All Ords. I have defined a bear market as a 20% or greater fall in shares that is not fully reversed within 12 months. Source: Global Financial Data, Bloomberg, AMP Capital

    Since 1900 there have been 12 gummy bear markets (in black) and six grizzly bears (in red). Several points stand out.

    • First, gummy bear markets tend to be shorter & see smaller declines around 26% compared to 46% for the grizzly bears.
    • Second, the average rally over 12 months after the initial 20% fall is 15% for the gummy bear markets but it’s a 23% decline for the grizzly bear markets.
    • Third, the deeper grizzly bear markets are invariably associated with recession, whereas the milder gummy bear markets including the 1987 share market crash tend not to be. All the six grizzly bear markets, excepting that of 1951-52, saw either a US or Australian recession or both whereas less than half of the gummy bear markets saw recession. It’s also the case for the US share market.
    • Finally, once the bear market ends the rebound is strong with an average gain of 29%. Trying to time this is hard with many who get out on the way down finding they don’t get back in until the market has risen above where they sold!

    Recession versus depression or something else?

    So, one of the key messages from history is that if we have a recession then the bear market will likely be grizzly and severe with markets even lower than they are today in 12 months’ time. It’s not necessarily that simple though as the shock this time is very different to those seen in the past. But first the bad news. Recession now looks inevitable. There is now even talk of “depression”. While there is a huge unknown around how long it will take to control the virus and hence how long the shutdowns will last it is looking clear that the short term hit to GDP will be deeper than anything seen in the post WW2 period hence the increasing references to the pre-war depression:

    • Chinese business conditions PMIs for February fell an unprecedented 24 points due to shutdowns starting 23rd January. Consistent with this Chinese economic activity indicators are down 20% from levels a year ago. Chinese March quarter GDP could well be down 10% or so.
    • Business conditions PMIs for the US, Eurozone, Japan and Australia all plunged in March as lockdowns ramped up. The average decline for these countries composite business conditions PMIs was an unprecedented 12 pts. This takes them below levels seen in the GFC. And the shutdowns have only just started so further falls are likely in April. So like China, developed countries could conceivably see 10% or so falls in GDP centred around the June quarter.

    g3 bus conditions pmis

    Source: Bloomberg, AMP Capital

    impact to Australia GDP from covid19

    Source: ABS, AMP Capital

    • By way of example the next chart shows the industry make-up of the Australian economy. The shutdowns will see a large hit to roughly 25% of the Australian economy, particularly accommodation & culture, retailing & real estate.

    Big differences v past recessions and depressions

    But while the slump in economic activity may be deeper than anything seen in the post war period, depression may not be the best description. Most definitions of depression focus on it being over several years and seeing a very deep fall in GDP compared to a recession which is shorter and shallower. The current hit to economic activity may be very deep but it won’t necessarily be longer than past recessions. And there is good reason to believe that if the virus comes under control in the next 2-6 months and we minimize the collateral damage from the shutdowns that the hit to activity may be shorter. There are big differences between the current situation and that of past recessions and Great Depression of the 1930s:

    • First, recessions and The Great Depression (which saw GDP contract by 36% over 4 years and unemployment rise to 25% in the US and GDP fall by 9.4% in Australia with a rise in unemployment to 20%) were preceded by a period of excess in terms of investment, consumer discretionary spending, private debt growth and inflation that had to be unwound. This time around there has been no generalised period of excess and there has been no large-scale monetary tightening to bring on a downturn.
    • Second, monetary policy was tightened in the lead up to past recessions and in the early phase of the Great Depression whereas global monetary policy was eased last year and that easing has accelerated this month with rate cuts, a renewed ramp up of quantitative easing (QE) and central banks around the world establishing various ways to ensure credit flows to the economy. In the 1930s banks were simply allowed to fail. Now they are being supported by ultra-cheap funding. Much of this owes to the GFC experience which has made it easier for central banks to now ramp up QE and introduce support mechanisms.
    • Third, going into the Great Depression fiscal policy was tightened to balance budgets whereas in the last month we have seen massive and still growing global fiscal policy stimulus swamping that of the GFC. The latest US fiscal stimulus package alone is around 9% of US GDP.

    g20 countries fiscal thrust

    Source: IMF, AMP Capital

    • Fourth, there has been no trade war such as the Smoot-Hawley 20% tariffs on US imports that were met by global retaliation and saw global trade collapse in the 1930s.

    The bottom line is that while we may see the biggest hit to global and Australian GDP since the 1930s thanks to the shutdowns, there are big differences compared to the Depression suggesting that a long drawn out global downturn is not inevitable. Basically, it’s a disruption to normal activity caused by the need to stay at home. In fact, growth could rebound quickly once the virus is under control and policy stimulus impacts. Which in turn should benefit share markets and could see this latest bear market turn into a gummy bear market rather than a grizzly bear market. Of course, at this point we are still waiting for convincing evidence that markets have bottomed. And the key is that the number of new cases of coronavirus starts to slow and that collateral damage from the shutdowns are kept to a minimum.

    Closing Comment

    Wow a lot can change in a short period of time!

    In my last update I acknowledge there was a lot we did not know about this event and how it may play out. I finished with what we do know. After 31 years in Financial Planning
    I have learnt that numbers and history do not lie, that’s why we are obsessed with numbers and graphs to illustrate, our conclusions.

    I now ask you to re-read the table above, of what happened to the Australian Share market over the past 100 years when negative events occurred Globally, then look at the % gain in first 12 months after a low. Numbers don’t lie, nor history. Markets will recover, and when you’re sick you talk to the Medical Dr, when your financial affairs are sick talk to the Financial Dr. Now more than ever, you need to talk and review your situation to navigate out of here.

    Please feel free to call us, we’re here to help you.

    Bill and the team at SFP.


    Remember we are available to help you during this unprecedented time…

    If you have ANY please get in touch to speak with one of our Financial Planners we’re here to help, either book a virtual meeting of get in contact with us on 02 9328 0876.


    Article by Bill Bracey – Principal & Senior Financial Planner | Sydney Financial Planning


    This article was prepared by Dr Shane Oliver. Dr Shane Oliver who provides economic forecasts and analysis of key variables and issues affecting, or likely to affect, all asset markets. He also provides economic forecasts and analysis of key variables and issues affecting, or likely to affect, all asset markets.

    Important note: While every care has been taken in the preparation of this document, AMP Capital Investors Limited (ABN 59 001 777 591, AFSL 232497) and AMP Capital Funds Management Limited (ABN 15 159 557 721, AFSL 426455) make no representations or warranties as to the accuracy or completeness of any statement in it including, without limitation, any forecasts. Past performance is not a reliable indicator of future performance. This document has been prepared for the purpose of providing general information, without taking account of any particular investor’s objectives, financial situation or needs. An investor should, before making any investment decisions, consider the appropriateness of the information in this document, and seek professional advice, having regard to the investor’s objectives, financial situation and needs. This document is solely for the use of the party to whom it is provided.

    General Disclaimer: This article contains information that is general in nature. It does not take into account the objectives, financial situation or needs of any particular person. You need to consider your financial situation and needs before making any decisions based on this information. Please seek personal financial advice prior to acting on this information.

    Federal Government Stimulus Package 2020

    Further Federal Government stimulus package announced

    Federal Government Stimulus Package 2020

    The new measures include initiatives for individuals, households and businesses. Business initiatives include measures to both enhance cashflow and provide easier access to credit.
    Enabling legislation (where required) is expected to be introduced to Parliament in the sitting week commencing 23 March 2020.

    The proposed measures are briefly summarised below and will require passage of legislation and/or regulations to provide certainty as to the specifics of the proposals.

    Federal Budget: the Government has also announced that due to continuing uncertainty associated with the Coronavirus pandemic that the Federal Budget which was due to be handed down in May will be deferred until 6 October 2020.

    1. Measures to support individuals & households

    Proposed effective date: various, see below.

    Temporary early access to superannuation.

    Proposed effective date: 2019-20 and first quarter (approx.) 2020-21. Applications available from mid-April 2020.

    The Government recognises that immediate financial necessities may temporarily outweigh the stated purpose of superannuation as a retirement savings vehicle and will temporarily allow additional early access to super savings in prescribed circumstances.

    People who meet the below criteria will be allowed to access:

    • up to $10,000 of their super before 1 July 2020, and
    • up to an additional $10,000 in the three months starting from 1 July 2020 (timeframe is approximate and subject to legislation).

    Amounts released under these rules will be paid tax-free and will not affect Centrelink or DVA payments.

    Individuals eligible to apply for early release include:

    • Those who are unemployed; or
    • Those eligible to receive Jobseeker Payment, equivalent Youth Allowance, Parenting Payment, Special Benefit or Farm Household Allowance; or

    Those who on or after 1 January 2020:

    • Were made redundant; or
    • Had their working hours reduced by 20% or more; or
    • As a sole trader, their business was suspended or turnover decreased by at least 20%.

    Those eligible must apply to the ATO through the MyGov website and must self-certify that they meet the above requirements. The ATO will then process the application and issue a Determination to the applicant and their super fund.

    The super fund will be able to then pay the applicant directly. Those eligible will only be allowed one withdrawal application in each period (i.e. cannot ‘top-up’ by making a second request if an original withdrawal for less than $10,000 was made).

    Applications for early release of super under this measure are expected to commence from mid-April 2020, approval and benefit payment time frames have not been announced at the time of writing.

    Early release of super benefits under this measure will also be available to members of SMSFs.

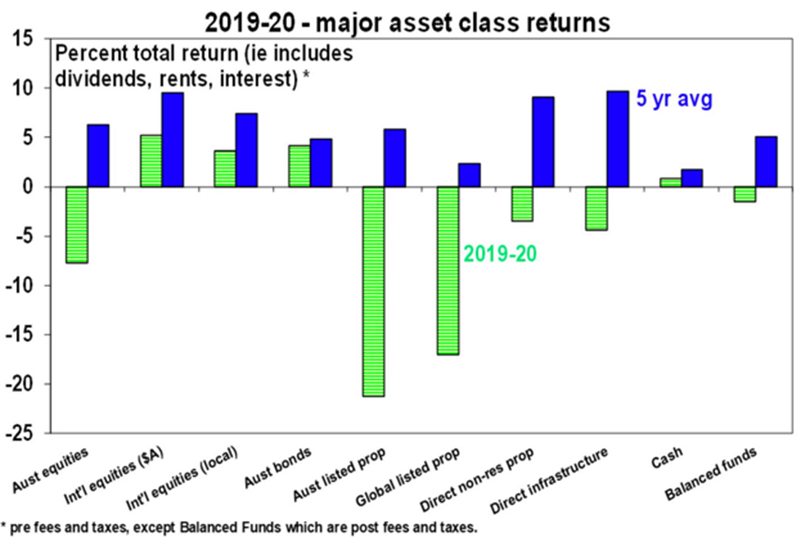
    Accessing super benefits in times of market down-turns is usually not recommended as it may crystallise losses. However members who experience loss of employment or a significant decrease in income may find this measure provides immediate financial relief and the basis to re-build.

    Further details of this measure are available in this fact sheet released by Treasury.

    Support for retirees – temporary reduction in minimum pension drawdown requirements

    Proposed effective date: Financial years 2019-20 and 2020-21.

    Similar to measures that applied following the 2008 Global Financial Crisis, the Government has proposed a 50% reduction in the minimum income drawings required from account based pensions and similar products for the 2019-20 and 2020-21 income years.

    This measure is designed to allow those whose circumstances permit to reduce income payments from their superannuation based pensions or income streams so as to minimise the need to sell down assets in depressed markets.

    Those who have already taken 50% or more of the required minimum payment in the 2019-20 financial year could contact their fund and cease any further payments until 30 June (subject to passage of regulations/legislation).

    This measure is not compulsory. Individuals who need the income or simply do not wish to reduce their income payments need not take action.

    Superannuation pensioners who are funding their income requirements from a cash account may also decide to take no action.

    Details of this measure are available in this Fact Sheet released by Treasury.

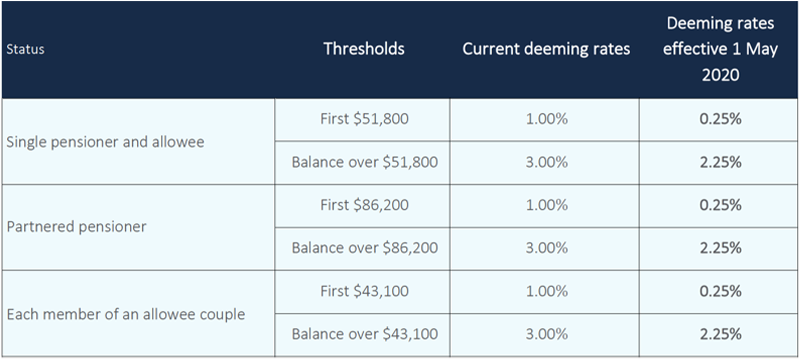
    Support for retirees and income support recipients – further reduction in deeming rates

    Proposed effective date: 1 May 2020.

    Adding to the 12 March 2020 announcement, the Government has announced a further 0.25% reduction in deeming rates.

    This will mean that part-rate pensioners and allowees will have less income assessed from their financial investments. If a recipient is income tested, the effect of the reduced deeming rate may result in an increase in social security entitlements.

    Any increase in the amount of income support received due to the reduction in deeming rates will commence to flow through to clients’ bank accounts from 1 May 2020.

    The following table illustrates the new deeming rates:

    Table 1: Reduction in deeming rates

    sfp e16 001 reduction in deeming rates

    Payments to income support recipients (households)

    Proposed effective date: various, see below.

    The Government will now provide two payments of $750 to eligible social security, veteran and other income support recipients (including concession card holders). Each $750 payment is a set amount, regardless that the recipient may have multiple eligibility (e.g. be an income support recipient and concession card holder).

    The first payment will be made to those receiving eligible income support or other benefits as at 12 March 2020, or those who have applied for a benefit as at that date (or up to 13 April 2020) and are subsequently approved.

    The second payment will be available to those who are eligible income support recipients or concession card holders as at 10 July 2020 and will be paid automatically from 13 July 2020. However, those who are receiving a payment that is eligible to receive the Coronavirus supplement (see below) will not receive this second $750 payment.

    Each eligible person in a household can receive the payment (e.g. a pensioner couple would receive a total of $1,500 in each round of payments).

    The payments will be exempt from tax and not included in the income test for social security, veteran or Farm Household Allowance payments.

    Eligible recipients must be residing in Australia. For the first payment, eligible benefits include:

    • Age Pension
    • Disability Support Pension
    • Pension Concession Card
    • Carer Payment and Allowance
    • Commonwealth Seniors Health Card
    • Veteran and War Widow(er) payments
    • Veteran Gold Card
    • Youth Allowance
    • Newstart Allowance/Jobseeker payment
    • Farm Household Allowance
    • Family Tax Benefit
    • Parenting Payment
    • Austudy
    • Partner Allowance

    The first payment will be made from 31 March 2020 with 90% of payments expected to be made by mid-April 2020.

    The payment will be made automatically to income support recipients. Those whose only qualifying benefit is a concession card will be contacted to confirm bank account details.

    In addition, eligibility criteria for benefits such as Sickness Allowance and Youth Allowance or other study related payments will be relaxed where the recipient can demonstrate inability to work or lack of compliance is due to Coronavirus related causes.

    To be eligible for the second payment the person must be residing in Australia and receiving one of the payments or concession cards listed above except for payments which receive the Coronavirus supplement (see below).

    These excluded payments include: Jobseeker Payment, equivalent Youth Allowance, Parenting Payment, Special Benefit or Farm Household Allowance.

    The Government Fact Sheet on Payments to Households is available from Treasury.

    Enhanced income support for individuals

    Proposed effective date: 27 April 2020

    The Government is temporarily expanding eligibility to income support payments and establishing a new temporary ‘Coronavirus supplement’. The supplement will be paid at the fixed rate of $550 per fortnight for six months commencing 27 April 2020 and is in addition to existing income support payments.

    Those eligible for the supplement include existing and new recipients of the following payments:

    • The Jobseeker Payment (previously Newstart Allowance and other payments transitioning to the Jobseeker Payment);
    • Youth Allowance (YA) Jobseeker Payment;
    • Parenting Payment (partnered and single);
    • Farm Household Allowance; and
    • Special Benefit recipients.

    For the period of the Coronavirus supplement there will also be expanded access to the payments listed above.

    The Jobseeker payment (and YA Jobseeker payment) will be available to permanent employees who lose their jobs. These payments will also be available to sole traders, self-employed and contract or casual workers whose reduced income meets the income test criteria.

    Asset testing of Jobseeker payment, YA Jobseeker payment and Parenting Payment will be waived for the period of the supplement.

    The one week ordinary waiting period has already been waived and the Liquid Assets Waiting Period (LAWP) will also be waived for those eligible for the supplement. Those already serving a LAWP will have the remainder waived.

    Income maintenance periods and compensation preclusion periods will continue to apply. Claimants for the Jobseeker payment will have to certify that they are not receiving or eligible for paid employer leave or accessing income protection payments.

    At this time measures are also being taken to streamline the application process including reduced documentation requirements and relaxation of mutual obligation and study requirements where these are impacted by the Coronavirus.

    Details of this measure are available in this Fact Sheet released by Treasury.

    2. Measures to support small and medium size employers

    Proposed effective date: Various – see below

    With reference to the tax-free payment announced by the Government on 12 March 2020 to boost cash flow for small and medium size businesses.

    The Government has now indicated it will enhance that previously announced tax-free cash flow boosting payment. Instead of the previously announced $25,000 maximum, the government is to now provide up to $100,000 (minimum payment of $20,000) to eligible small and medium-sized businesses. Payments will now also be made to eligible not for-profits (NFPs including charities) that employ people.

    Small and medium-sized business entities (including NFPs/charities) with aggregated annual turnover under $50 million and that employ workers are eligible.

    The payments will only be available to active eligible employers established prior to 12 March 2020. However, charities which are registered with the Australian Charities and Not-for-profits Commission will be eligible regardless of when they were registered, subject to meeting other eligibility requirements. This recognises that new charities may be established in response to the Coronavirus pandemic.

    Under the enhanced arrangements, tax-free payments will be made in two stages.

    First stage

    Eligible businesses that withhold tax to the ATO on their employees’ salary and wages will under the first stage receive a payment equal to 100% (up from 50%) of the amount withheld, up to a maximum payment of $50,000.

    Eligible businesses that pay salary and wages will receive a minimum payment of $10,000 (up from $2,000) even if they are not required to withhold tax.
    The tax-free payment in this first stage will be delivered by the ATO as a credit in the activity statement system from 28 April 2020 upon businesses lodging eligible upcoming activity statements.

    Second stage

    In the second stage, additional payments will be made in the July – October 2020 period. To qualify for the additional second stage payments, the entity must continue to be active.

    Eligible entities will receive the additional payments equal to the total of all of the boosting cash flow for employers payment they received under the first stage. This means that eligible entities will receive at least $20,000 (2 x $10,000) minimum, up to a total of $100,000 (2 x $50,000) maximum combined under both payments.

    For monthly activity statement lodgers, the additional second stage payments will be delivered as an automatic credit in the activity statement system. This will be equal to a quarter of their total first stage Boosting Cash Flow for Employers payment and received following the lodgement of their June 2020, July 2020, August 2020 and September 2020 activity statements (up to a total of $50,000).

    For quarterly activity statement lodgers, the additional second stage payments will also be delivered as an automatic credit in the activity statement system. This will be equal to half of their total first stage Boosting Cash Flow for Employers payment and received following the lodgement of their June 2020 and September 2020 activity statements (up to a total of $50,000).

    Further details of this measure are available in this Fact Sheet released by Treasury.

    Other measures announced to support the cash flow needs of small and medium-sized business entities include:

    Under a ‘Coronavirus SME Guarantee Scheme’, the government will provide a guarantee of 50% to SME lenders to support new short-term unsecured loans to SMEs. The Scheme will guarantee up to $40 billion of new lending. According to the government, this will provide businesses with funding to meet cash flow needs by further enhancing lenders’ willingness and ability to provide credit.

    The government is also cutting red tape by providing a temporary exemption from responsible lending obligations for lenders providing credit to existing small business customers. This reform is aimed at helping small businesses get access to credit quickly and efficiently.

    As always I want to reiterate that myself and the team at SFP are here to answer ANY questions you may have during this time. Stay safe in these uncertain times, we’re in this together.


    Bill and the team at SFP.


    If you have ANY questions during this unprecedented time…

    Please get in touch to speak with your Financial Planner we’re here to help, either book a virtual meeting of get in contact with us on 02 9328 0876.


    Bill Bracey – Principal & Senior Financial Planner | Sydney Financial Planning


    General Disclaimer: This article contains information that is general in nature. It does not take into account the objectives, financial situation or needs of any particular person. You need to consider your financial situation and needs before making any decisions based on this information. Please seek personal financial advice prior to acting on this information.

    Coronavirus and Financial Markets Melt Down

    Coronavirus and financial markets melt down. What to do?

    Coronavirus and Financial Markets Melt Down

    Maybe I was wrong? Australians rushing out buying toilet paper and fighting over it like it was gold being handed out for free.

    Some wise person once said:

    “Off with the head and on goes a pumpkin!”

    Thank god my clients still have their own head and use the knowledge they have gained through us and are not making irrational decisions about their investments.

    Yes, the phone rang, and yes, we are all concerned, but the vast majority asked me then same question.

    Q: “Bill, in all your correspondence you have sent us this calendar year – is this what you meant when you said, “This is how the rich get richer and the poor get poorer”?

    A: YES!

    Then most asked me…

    Q: “Is the time right now to start to invest when assets values have fallen greatly?”

    A: YES! (but I also say) patience grasshopper.


    This crisis will eventually pass, as investors and Australians become accustomed to the new normal that included the new coronavirus COVID-19, becoming a normal part of daily life along with the flu, obesity, car accidents and other medical issues.

    The difficult part is the ‘unknown’ as we don’t know how long the dislocation phase will last, where we need to reduce social interaction and possible isolation for a limited time. This has significant economic impacts and greatly increases the probability of a recession.

    The global markets have moved from raging Bull to Bear Market. How long will this last and when is it good to start investing again?

    That’s the Million-dollar question.

    The answer is; nobody knows. The best advice is everybody’s situation is vastly different and you need individual high-quality advice.

    What I do know is;

    • That we are in a bear market and we don’t know how far away the bottom is.
    • That right now there is possibly some phenomenal buying opportunities.
    • That markets perform over time and bounce back as seen in the below table.

      sfp e15 001 us stock markets 10 worst days

      Source: Schroders. Refinitv data correct as at 3 March, 2020. Data shown is for the S&P 500 Total Return Index, which includes price increases and dividend payments. Past performance is not a guide to future returns. 413199

    • This is a period of adjustment because we are moving from a long Bull market and nobody can ever pick the bottom of the Bear Market (nor the top of the Bull Market for that matter).
    • If you buy somewhere towards the bottom of the market, there is exceptional value and money to be made.
    • In times like this, the poor unadvised panic and sell at the bottom, and the well-advised rich buy from the poor. That’s how the Rich get Richer!
    • I’ve started investing part of my spare cash back into to the market.
    • I’ve been through many of these volatile times before I’ve learnt what to do and how to best advise clients, as do all our Financial Planners at Sydney Financial Planning.

    If you still have questions and things are not clear; I urge you to arrange to talk with your Financial Planner.


    Bill Bracey and the advice team


    Have you set things up to weather this trend?

    If you need your personal situation reviewed by your Financial Planner or you don’t have a planner yet, get in contact with us on 02 9328 0876.


    Bill Bracey – Principal & Senior Financial Planner | Sydney Financial Planning

    General Disclaimer: This article contains information that is general in nature. It does not take into account the objectives, financial situation or needs of any particular person. You need to consider your financial situation and needs before making any decisions based on this information. Please seek personal financial advice prior to acting on this information.

    2020 plunge in shares

    The plunge in shares – seven things investors need to keep in mind

    2020 plunge in shares

  • Shares may still have more downside and the uncertainty around the coronavirus crisis is very high, but we are of the view that it’s just another correction.
  • Key things for investors to bear in mind are that: corrections are normal; in the absence of recession, a deep bear market is unlikely; selling shares after a fall locks in a loss; share pullbacks provide opportunities for investors to buy them more cheaply; while shares may have fallen, dividends are smoother; and finally, to avoid getting thrown off a long-term investment strategy it’s best to turn down the noise during times like this.
  • Introduction

    The plunge in share markets over the last week has generated much coverage and consternation. This is understandable given the rapidity of the falls – with US shares having their fastest 10% fall from an all-time high on record – and the uncertainty around the coronavirus (Covid-19) and its impact on economic activity. From their highs to recent lows US shares have fallen 13%, Eurozone shares have fallen 16%, Japanese and Chinese shares have fallen 12% and Australian shares have fallen 12%. This note looks at the issues for investors and puts the falls into context.

    What’s driving the latest plunge?

    The plunge basically reflects two things.

    • After very strong gains from their last greater than 5% correction into August last year, share markets had become vulnerable to a correction.
    • The uncertainty around the impact of the coronavirus outbreak which is on the verge of becoming a pandemic and its impact on global growth has unnerved investors dramatically. Shares had recovered from their initial fall on the back of the virus into early February on signs that the number of new cases in China was falling (which is continuing), limited cases outside China and expectations that policy easing would limit any damage. This has been blown apart in the last week as cases have popped up en masse in Italy, South Korea and Iran, more cases have appeared elsewhere around the world and this has resulted in expectations of a deeper and longer hit to global growth.

    After big falls shares have become technically oversold, measures of negative investor sentiment such as the VIX (or fear) index and demand for option protection have spiked. So, shares could have a short-term bounce. But given the uncertainties around Covid-19 – with more cases in the US and Australia likely to pop up – the situation could get worse before it gets better, so the share pullback could have further to go – notwithstanding short-term bounces.

    Considerations for investors

    Sharp market falls with headlines screaming that billions of dollars have been wiped off the share market are stressful for investors as no one likes to see the value of their investments decline. The current situation is doubly stressful because of fears for our own and others health – particularly for the elderly. However, several things are worth bearing in mind:

    First, while they all have different triggers and unfold a bit differently to each other, periodic corrections in share markets of the order of 5%, 15% and even 20% are healthy and normal. For example, during the tech/dot-com boom from 1995 to early 2000, the US share market had seven pull backs greater than 5% ranging from 6% up to 19% with an average decline of 10%. During the same period, the Australian share market had eight pullbacks ranging from 5% to 16% with an average fall of 8%. All against a backdrop of strong returns every year.

    During the 2003 to 2007 bull market, the Australian share market had five 5% plus corrections ranging from 7% to 12%, again with strong positive returns every year. More recently, the Australian share market had a 10% pullback in 2012, an 11% fall in 2013 (the taper tantrum), an 8% fall in 2014, a 20% fall between April 2015 and February 2016, a 7% fall early in 2018, a 14% fall between August and December 2018 and a 7% fall into August last year. And this has all been in the context of a gradual rising trend. And it has been similar for global shares – with the last big fall in US shares being a 20% plunge into Christmas eve 2018. See the next chart. While they can be painful, share market corrections are healthy because they help limit a build-up in complacency and excessive risk taking.

    sfp e14 001 corrections normal

    Source: Bloomberg, AMP Capital

    sfp e14 002 Australian shares climb a wall of worry

    Source: Bloomberg, AMP Capital

    Related to this, shares climb a wall of worry over many years with numerous events dragging them down periodically, but with the long-term trend ultimately up & providing higher returns than other more stable assets. Bouts of volatility are the price we pay for the higher longer-term returns from shares.

    Second, the main driver of whether we see a correction (a fall of 5% to 15%) or even a mild bear market (with say a 20% decline that turns around relatively quickly like we saw in 2015-2016) as opposed to a major bear market (like that seen in the global financial crisis (GFC)) is whether we see a recession or not – notably in the US as the US share markets tends to lead for most major global markets. The next table shows US share market falls greater than 10% since the 1970s. I know it’s heavy – but I like this table! The first column shows the period of the fall, the second shows the decline in months, the third shows the percentage decline from top to bottom, the fourth shows whether the decline was associated with a recession or not and the fifth shows the gains in the share market one year after the low. Falls associated with recessions are highlighted in red.

    sfp e14 003 falls in us market greater than 1970s

    Source: Bloomberg, AMP Capital

    Several points stand out:

    • First, share market falls associated with recession tend to be longer and deeper. 
    • Second, after the low the, share markets generally rebound sharply – which invariably makes it very hard for investors to time, as by the time they realise what has happened and get back in the market is above where they sold. 
    • Finally, as would be expected the share market rebound in the year after the low is much greater following falls associated with recession.

    So, whether a recession is imminent or not in the US is critical in terms of whether we will see a major bear market or not. In fact, the same applies to Australian shares. Our assessment is that a US/global recession is not inevitable. We have not seen the excesses – in terms of overall debt growth (although housing debt is a source of risk in Australia), overinvestment, capacity constraints and inflation – that normally precede recessions in the US, globally or Australia. And we have not seen the sort of monetary tightening that leads into recession. In fact, monetary conditions remain very easy. However, the uncertainty around the coronavirus outbreak and the likelihood of economic shutdowns designed to contain it beyond those in China do suggest a greater than normal risk on this front. That said even if there were a recession growth would likely rebound quickly once the virus came under control as economic activity sprang back to normal helped by policy stimulus.

    Third, selling shares or switching to a more conservative investment strategy or superannuation option after a major fall just locks in a loss. With all the talk of billions being wiped off the share market, it may be tempting to sell. But this just turns a paper loss into a real loss with no hope of recovering. The best way to guard against making a decision to sell on the basis of emotion after a sharp fall in markets (as many including me are tempted to do!) is to adopt a well thought out, long-term strategy and stick to it.

    Fourth, when shares and growth assets fall, they are cheaper and offer higher long-term return prospects. So, the key is to look for opportunities the pullback provides – shares are cheaper and some more than others. It’s impossible to time the bottom but one way to do it is to average in over time.

    Fifth, while shares have fallen, dividends from the market haven’t. They will come under some pressure as the economy and profits take a hit from a deeper and longer coronavirus outbreak. But companies like to smooth their dividends over time – they never go up as much as earnings in the good times and so rarely fall as much in the bad times. So, the income flow you are receiving from a well-diversified portfolio of shares is likely to remain attractive, particularly against bank deposits.

    sfp e14 004 aust shares offer attractive yield

    Source: RBA, Bloomberg, AMP Capital

    Sixth, shares and other related assets often bottom at the point of maximum bearishness, ie, just when you and everyone else feel most negative towards them. So, the trick is to buck the crowd. “Be fearful when others are greedy. Be greedy when others are fearful,” as Warren Buffett has said.

    Finally, turn down the noise. At times like this, negative news reaches fever pitch. Talk of billions wiped off share markets and warnings of disaster help sell copy and generate clicks & views. But we are rarely told of the billions that market rebounds and the rising long-term trend in share prices adds to the share market. Moreover, they provide no perspective and only add to the sense of panic. All of this makes it harder to stick to an appropriate long-term strategy let alone see the opportunities that are thrown up. So best to turn down the noise.

    Concluding Comment

    So in summary as I suggested in January in my update to you, times like this offer opportunity and we have seen times like this before. This is where the rich get richer and the poor non advised, get poorer.

    Please take time to watch my 5 minute video that explains what you should be doing with this market.


    Now more than ever its important to keep your nerve and shut out the media who pump FEAR into the masses.

    Please feel free to contact us at Sydney Financial Planning, we are experienced at dealing with volatile times and know what to do.

    Bill Bracey and the team


    Have you set things up to weather this trend?

    If you need your personal situation reviewed by your SFP Planner or you don’t have a planner yet, get in contact with us on 02 9328 0876.


    Bill Bracey – Principal & Senior Financial Planner | Sydney Financial Planning


    This article was prepared by Dr Shane Oliver. Dr Shane Oliver who provides economic forecasts and analysis of key variables and issues affecting, or likely to affect, all asset markets. He also provides economic forecasts and analysis of key variables and issues affecting, or likely to affect, all asset markets.

    Important note: While every care has been taken in the preparation of this document, AMP Capital Investors Limited (ABN 59 001 777 591, AFSL 232497) and AMP Capital Funds Management Limited (ABN 15 159 557 721, AFSL 426455) make no representations or warranties as to the accuracy or completeness of any statement in it including, without limitation, any forecasts. Past performance is not a reliable indicator of future performance. This document has been prepared for the purpose of providing general information, without taking account of any particular investor’s objectives, financial situation or needs. An investor should, before making any investment decisions, consider the appropriateness of the information in this document, and seek professional advice, having regard to the investor’s objectives, financial situation and needs. This document is solely for the use of the party to whom it is provided.

    General Disclaimer: This article contains information that is general in nature. It does not take into account the objectives, financial situation or needs of any particular person. You need to consider your financial situation and needs before making any decisions based on this information. Please seek personal financial advice prior to acting on this information.

    Economy review of 2019 and outlook for 2020

    Review of 2019, outlook for 2020 – the beat goes on

    Economy review of 2019 and outlook for 2020

  • 2020 is likely to see global growth pick up with monetary policy remaining easy. Expect the RBA to cut the cash rate to 0.25% and to undertake quantitative easing.
  • Against this backdrop, share markets are likely to see reasonable but more constrained & volatile returns, and bond yields are likely to back up resulting in good but more modest returns from a diversified mix of assets.
  • The main things to keep an eye on are: the trade wars; the US election; global growth; Chinese growth; and fiscal versus monetary stimulus in Australia.
  • 2019 – growth down, returns up

    Christmas 2018 was not a great one for many investors with an almost 20% slump in US shares from their high in September to their low on Christmas Eve, capping off a year of bad returns from share markets and leading to much trepidation as to what 2019 would hold. But 2019 has turned out to be a good year for investors, defying the gloom of a year ago. In fact, some might see it as perverse – given all the bad news around and the hand wringing about recession, high debt levels, inequality and the rise of populist leaders. Then again that’s often the way markets work – bottoming when everyone is gloomy then climbing a wall of worry. The big global negatives of 2019 were:

    • The trade war and escalating US-China tensions generally. A trade truce and talks collapsed several times leading to a new ratcheting up of tariffs before new talks into year end. 
    • Middle East tensions flared periodically but without a lasting global impact & the Brexit saga dragged on although a near-term hard Brexit looks to have been avoided.
    • Slowing growth in China to 6%. This largely reflected an earlier credit tightening, but the trade war also impacted.
    • Slowing global growth as the trade war depressed investment & combined with an inventory downturn and tougher auto emissions to weigh on manufacturing & profits.
    • Recession obsession with “inverted yield curves” – many saw the growth slowdown as turning into a recession.

    But it wasn’t all negative as the growth slowdown & low inflation saw central banks ease, with the Fed cutting three times and the ECB reinstating quantitative easing. This was the big difference with 2018 which saw monetary tightening.

    Australia also saw growth slow – to below 2% – as the housing construction downturn, weak consumer spending and investment and the drought all weighed. This in turn saw unemployment and underemployment drift up, wages growth remain weak and inflation remain below target. As a result, the RBA was forced to change course and cut interest rates three times from June and to contemplate quantitative easing.The two big surprises in Australia were the re-election of the Coalition Government which provided policy continuity and the rebound in the housing market from mid-year.

    While much of the news was bad, monetary easing and the prospect it provided for stronger growth ahead combined with the low starting point resulted in strong returns for investors. Investment returns for major asset classes 2019

    *Yr to date to Nov. Source: Thomson Reuters, Morningstar, REIA, AMP Capital

    • Global shares saw strong gains as markets recovered from their 2018 slump, bond yields fell making shares very cheap and monetary conditions eased. This was despite several trade related setbacks along the way. Global share returns were boosted on an unhedged basis because the $A fell.
    • Emerging market shares did well but lagged given their greater exposure to trade and manufacturing and a still rising $US along with political problems in some countries.
    • Australian share prices finally surpassed their 2007 record high thanks to the strong global lead, monetary easing and support for yield sensitive sectors from low bond yields.
    • Government bonds had strong returns as bond yields fell as inflation and growth slowed, central banks cut rates and quantitative easing returned.
    • Real estate investment trusts were strong on the back of lower bonds yields and monetary easing.
    • Unlisted commercial property and infrastructure continued to do well as investors sought their still relatively high yields. However, Australian retail property suffered a correction.
    • Commodity prices rose with oil & iron up but metals down.
    • Australian house prices fell further into mid-year before rebounding as the Federal election removed the threat to negative gearing & the capital gains tax discount, the RBA cut interest rates and the 7% mortgage test was relaxed.
    • Cash and bank term deposit returns were poor reflecting new record low RBA interest rates.
    • The $A fell with a lower interest rates and a strong $US.
    • Reflecting strong gains in most assets, balanced superannuation funds look to have seen strong returns.

    2020 vision – growth up, returns still good

    The global slowdown still looks like the mini slowdowns around 2012 and 2015-16. Business conditions indicators have slowed but remain far from GFC levels. See next chart.

    Global manufacturing PMI vs bank policy direction

    While the slowdown has persisted for longer than we expected – mostly due to President Trump’s escalating trade wars – a global recession remains unlikely, barring a major external shock. The normal excesses that precede recessions like high inflation, rapid growth in debt or excessive investment have not been present in the US and globally. While global monetary conditions tightened in 2018, they remained far from tight and the associated “inversion” in yield curves has been very shallow and brief. And monetary conditions have now turned very easy again with a significant proportion of central banks easing this year. See chart. The big global themes for 2020 are likely to be:

    • A pause in the trade war but geopolitical risk to remain high. The risks remain high on the trade front – with President Trump still ramping up mini tariffs on various countries to sound tough to his base and uncertainty about a deal with China, but he is likely to tone it down through much of 2020 to reduce the risk to the US economy knowing that if he lets it slide into recession and/or unemployment rise he likely won’t get re-elected. A “hard Brexit” is also unlikely albeit risks remain. That said geopolitical risks will remain high given the rise of populism and continuing tensions between the US & China. In particular, the US election will be an increasing focus if a hard-left candidate wins the Democrat nomination.
    • Global growth to stabilise and turn up. Global business conditions PMIs have actually increased over the last few months suggesting that monetary easing may be getting traction. Global growth is likely to average around 3.3% in 2020, up from around 3% in 2019. Overall, this should support reasonable global profit growth.
    • Continuing low inflation and low interest rates. While global growth is likely to pick up it won’t be overly strong and so spare capacity will remain. Which means that inflationary pressure will remain low. In turn this points to continuing easy monetary conditions globally, with some risk that the Fed may have a fourth rate cut.
    • The US dollar is expected to peak and head down. During times of uncertainty and slowing global growth like over the last two years the $US tends to strengthen partly reflecting the lower exposure of the US economy to cyclical sectors like manufacturing and materials. This is likely to reverse in the year ahead as cyclical sectors improve.

    In Australia, strength in infrastructure spending and exports will help keep the economy growing but it’s likely to remain constrained to around 2% by the housing construction downturn, subdued consumer spending and the drought. This is likely to see unemployment drift up, wages growth remain weak and underlying inflation remain below 2%. With the economy remaining well below full employment and the inflation target, the RBA is expected to cut the official cash rate to 0.25% by March, & undertake quantitative easing by mid-year, unless the May budget sees significant fiscal stimulus. Some uptick in growth is likely later in the year as housing construction bottoms, stimulus impacts and stronger global growth helps.

    Implications for investors

    Improved global growth and still easy monetary conditions should drive reasonable investment returns through 2020 but they are likely to be more modest than the double-digit gains of 2019 as the starting point of higher valuations and geopolitical risks are likely to constrain gains & create some volatility:

    • Global shares are expected to see returns around 9.5% helped by better growth and easy monetary policy. 
    • Cyclical, non-US and emerging market shares are likely to outperform, particularly if the US dollar declines and trade threat recedes as we expect.
    • Australian shares are likely to do okay but with returns also constrained to around 9% given sub-par economic & profit growth. Expect the ASX 200 to reach 7000 by end 2019.
    • Low starting point yields and a slight rise in yields through the year are likely to result in low returns from bonds.
    • Unlisted commercial property and infrastructure are likely to continue benefitting from the search for yield but the decline in retail property values will still weigh on property returns.
    • National capital city house prices are expected to see continued strong gains into early 2020 on the back of pent up demand, rate cuts and the fear of missing out. However, poor affordability, the weak economy and still tight lending standards are expected to see the pace of gains slow leaving property prices up 10% for the year as a whole.
    • Cash & bank deposits are likely to provide very poor returns.
    • The $A is likely to fall to around $US0.65 as the RBA eases further but then drift up a bit as global growth improves to end 2019 little changed.

    What to watch?

    The main things to keep an eye on in 2020 are as follows:

    • The US trade wars – we are assuming some sort of de-escalation in the run up to the presidential election, but Trump is Trump and often can’t help but throw grenades.
    • US politics: the Senate is unlikely to remove Trump from office if the House votes to impeach and another shutdown is also unlikely but both could cause volatility as could the US election if a hard-left Democrat gets up (albeit unlikely). 
    • A hard Brexit looks like being avoided but watch UK/EU free trade negotiations through the year.
    • Global growth indicators – like the PMI shown in the chart above need to keep rising.
    • Chinese growth – a continued slowing in China would be a major concern for global growth.
    • Monetary v fiscal stimulus in Australia – significant fiscal stimulus could head off further RBA rate cuts and quantitative easing.
    • Low interest rates – look like they’re here to stay for some time yet, that means low returns for cash.
    • Fixed Interest and Bonds – WILL REMAIN LOW YIELDING FOR INVESTORS IN THE SHORT TO MEDIUM TERM, assets like shares and property, can and will have volatility, these assets usually increase in times of extended low interest. I call it ” There’s no Other Option Theory”, IN SHORT, if you’re only getting approx. 1.5 % on cash and can ride out volatility, there really is no other option..

    Concluding comment

    Over time and studying economics for over 120 years, we’ve seen times like this before and what usually happens; is the rich get richer and the poor get poorer.

    The reason why? the rich can borrow money cheaply and can afford to borrow at low cost. Sadly the poor cannot and are forced to sell assets cheaply. Unfair as this is, it’s our job to use this knowledge to help our clients build wealth.

    Now more than ever it’s important to have an ongoing advice relationship with an experienced Financial Planner. Make sure you’re having your regular review with one of our experienced planners and start taking advantage of the knowledge we have to help build wealth.

    Happy New Year to all our clients and hang onto your hats for yet another interesting investment year.

    Bill Bracey and the SFP team.


    Have you set things up to weather this trend?

    If you need your personal situation reviewed by your SFP Planner or you don’t have a planner yet, get in contact with us on 02 9328 0876.


    Bill Bracey – Principal & Senior Financial Planner | Sydney Financial Planning


    Original article prepared by Dr Shane Oliver. Dr Shane Oliver who provides economic forecasts and analysis of key variables and issues affecting, or likely to affect, all asset markets. He also provides economic forecasts and analysis of key variables and issues affecting, or likely to affect, all asset markets.

    Important note: While every care has been taken in the preparation of this document, AMP Capital Investors Limited (ABN 59 001 777 591, AFSL 232497) and AMP Capital Funds Management Limited (ABN 15 159 557 721, AFSL 426455) make no representations or warranties as to the accuracy or completeness of any statement in it including, without limitation, any forecasts. Past performance is not a reliable indicator of future performance. This document has been prepared for the purpose of providing general information, without taking account of any particular investor’s objectives, financial situation or needs. An investor should, before making any investment decisions, consider the appropriateness of the information in this document, and seek professional advice, having regard to the investor’s objectives, financial situation and needs. This document is solely for the use of the party to whom it is provided.

    General Disclaimer: This article contains information that is general in nature. It does not take into account the objectives, financial situation or needs of any particular person. You need to consider your financial situation and needs before making any decisions based on this information. Please seek personal financial advice prior to acting on this information.

    Why recession in Australia is unlikely

    Nine reasons why recession remains unlikely in Australia

    Why recession in Australia is unlikely

  • However, while the risks have gone up, recession remains unlikely: tax cuts should help growth in the current half year; the threat from falling property prices has receded; infrastructure spending is booming; the low $A is helping growth; the drag from falling mining investment is over; the current account is in surplus; there is scope for extra fiscal stimulus; population growth remains strong; and cyclical spending is low.
  • Introduction

    Australian economic growth has slowed to the weakest since the GFC. Talk of recession remains all the rage. And economists don’t have a great track record in predicting recessions globally – with an IMF study finding that of 153 recessions seen in 63 countries around the world between 1992 and 2014, economic forecasters only predicted five in April of the year before they started – so why should they pick one this time? As someone who forecast two of the last one recessions in Australia I am a bit wary. Perhaps the best way to predict recessions would be to forecast one every year and then you would have a perfect track record in predicting them! Some actually do this. But they are totally useless because they miss out on the 90% or so of the time that countries are not in recession and the positive lead this provides for share markets and other growth assets.

    Recessions come along when there is a shock to the system (usually high interest rates), invariably at a time when the economy is vulnerable after a period of excess (such as rapid growth in spending, debt or inflation). The shock causes a loss of confidence, lots of little spending decisions are delayed and excesses are unwound. But given the natural tendency of most economies to grow given population growth and new innovations, increasing economic diversity, counter cyclical economic policies and the rise of the more stable services sector recessions are relatively rare at around 10-12% of the time globally. In Australia the last one was 28 years ago.

    Why there has been no recession for 28 years

    The absence of an Australian recession – whether defined by two quarterly GDP contractions in a row or negative annual growth – for 28 years is instructive. Many forecast recessions at the time of the 1997-98 Asian crisis, 2000-2002 tech wreck, the GFC and from around 2012 as the mining investment boom ended. But it didn’t happen. There are seven reasons why:

    • economic reforms made the economy more flexible;
    • the floating of the $A has seen it fall whenever there is a major economic problem providing a shock absorber;
    • desynchronised cycles across industry sectors;
    • strong growth in China that helped through the GFC;
    • strong population growth; 
    • counter cyclical economic policy – like stimulus payments and monetary easing that helped in the GFC; and
    • good luck – which can never be ignored lest hubris set in!

    But is our luck running out?

    June quarter GDP growth was just 0.5%. And annual growth has fallen to 1.4% which is the slowest since the GFC and below population growth of 1.6%. Housing and business investment fell, and consumer spending remains very weak. Were it not for public spending and net exports the economy would have gone backwards in the June quarter.

    Real Australian GDP Growth

    Source: ABS, AMP Capital

    Going forward, the housing downturn has further to run with building approvals pointing to a further fall in home building.

    Australian building approvals

    Source: ABS, AMP Capital

    This is likely to amount to a 0.5-0.6 percentage point pa direct detraction from growth. This along with low property turnover (less people moving) and lagged negative wealth effects from the earlier fall in house prices will all act as drags on consumer spending. In total the housing downturn is likely to detract around 1-1.2 percentage points from growth in the year ahead.

    The drought will likely also act as an ongoing drag on growth with a “mild” El Nino hanging around although this may be modest at around a 0.2 percentage point growth detraction. The threats to global growth from trade wars also suggests downside risks to export growth.

    The weakness in relation to the economy is clearly evident in soft profit results in the recent June half year profit reporting season. The ratio of upside surprise to downside was the weakest since 2009, only 58% of companies saw profits rise from a year ago and the proportion of companies raising or maintaining their dividends fell to the lowest since 2011 suggesting a lack of confidence. Earnings growth slowed to 1.3% and excluding resources stocks was around -2.4%.

    Australian companies seeing profit

    Source: AMP Capital

    Slow growth but probably not recession

    Since last year our view has been less upbeat on growth than the consensus and notably the RBA. This remains the case as the housing construction cycle turns down and weighs on consumer spending. As a result, it’s hard to see much progress in reducing high combined levels of unemployment and underemployment, and hence wages growth and inflation are likely to remain low. But there remains a bunch of positives that should help the economy avoid a recession even though growth will remain weak for a while yet. Here are nine.

    1. Rate cuts and tax cuts should provide some growth boost – while July retail sales were disappointing, the experience from the GFC stimulus payments is that the tax cuts will provide some lift to growth in the months ahead and various retailers have expressed optimism about this recently.
    2. The threat of crashing property prices looks to be receding – while it’s so far been on low volumes, buyer interest has returned to the Sydney and Melbourne markets and we never saw the much-feared surge in non-performing loans or forced selling. This has helped remove the threat of a debilitating negative wealth effect on consumer spending.
    3. Infrastructure spending is booming – recent state budgets saw the projected peak in infrastructure spending pushed out yet another year to 2020. And it’s likely states will seek to take even greater advantage of ultra-low long-term borrowing costs to further push out the peak in infrastructure spending.
    4. The low $A is helping to support the economy – the $A is down 39% from its 2011 high and is likely to fall further and this provides a boost to Australian businesses that compete internationally by making them more competitive.

    Actual expected capital expenditure

    Source: ABS, AMP Capital

    1. The business investment outlook is slowly improving – the big drag on growth as mining investment fell back to more normal levels as a share of GDP is over and mining investment plans are rising. This is driving some pick-up in the outlook for overall business investment.

    1. Australia has a current account surplus – the June quarter saw the first current account surplus since 1975. The slide since then in iron ore and coal prices suggests it may not be sustained, but the reasons for the improvement are more than just commodity prices so the deficit is likely to be well below the norm of recent decades going forward. What’s more there has been a significant improvement in our foreign liabilities with a less short-term debt and a growing net equity position. This all means that our reliance on foreign capital inflow has declined. So much for the boiling frog!
    2. There is scope for extra fiscal stimulus – the Federal budget is nearly back in surplus and while we have had a long run of deficits our public finances are in good shape compared to the US, Europe and Japan. As a result, there is scope to provide more fiscal stimulus and this is probably more important than a narrow focus on the surplus.
    3. Population growth remains strong – Australia’s population growth at around 1.6% pa remains strong. Of course, strong population growth is not without issues and in terms of living standards it is economic growth per person (or per capita) that matters. But solid population growth also has significant benefits in terms of supporting demand growth, preventing lingering oversupply and keeping the economy dynamic. 

    1. Finally, cyclical spending (consumer durables, housing and business investment) as a share of GDP remains low – suggesting that apart from bits of the housing market there’s not a lot of excess in the economy that needs to be unwound.

    Australian cyclical spending low

    Source: Bloomberg, ABS, AMP Capital

    Concluding comment

    Our assessment remains that growth will remain soft and that the RBA will have to provide more stimulus – by taking the cash rate to around 0.5% and possibly consider unconventional monetary policy like quantitative easing. Ideally the latter should be combined with fiscal stimulus which would be fairer and more effective. While Australian growth is going through a rough patch with likely further to go, recession remains unlikely barring a significant global downturn.


    Have you set things up to weather this trend?

    If you need your personal situation reviewed by your SFP Planner or you don’t have a planner yet, get in contact with us on 02 9328 0876.


    Bill Bracey – Principal & Senior Financial Planner | Sydney Financial Planning


    This article was prepared by Dr Shane Oliver. Dr Shane Oliver who provides economic forecasts and analysis of key variables and issues affecting, or likely to affect, all asset markets. He also provides economic forecasts and analysis of key variables and issues affecting, or likely to affect, all asset markets.

    Important note: While every care has been taken in the preparation of this document, AMP Capital Investors Limited (ABN 59 001 777 591, AFSL 232497) and AMP Capital Funds Management Limited (ABN 15 159 557 721, AFSL 426455) make no representations or warranties as to the accuracy or completeness of any statement in it including, without limitation, any forecasts. Past performance is not a reliable indicator of future performance. This document has been prepared for the purpose of providing general information, without taking account of any particular investor’s objectives, financial situation or needs. An investor should, before making any investment decisions, consider the appropriateness of the information in this document, and seek professional advice, having regard to the investor’s objectives, financial situation and needs. This document is solely for the use of the party to whom it is provided.

    This article contains information that is general in nature. It does not take into account the objectives, financial situation or needs of any particular person. You need to consider your financial situation and needs before making any decisions based on this information.

    Escalating US-China trade war

    Escalating US-China trade war

    Escalating US-China trade war

  • Share markets may need to fall further in the short term to remind both sides of the need for a deal and get them talking again.
  • However, we regard the fall in share markets as another correction rather than the start of a major bear market.
  • Introduction

    After a third round of talks made little progress last week, the US/China trade war has escalated badly with tit for tat moves on an almost daily basis by each side. This has seen share markets fall sharply with US, global and Australian shares down about 5-6% from recent highs and safe haven assets like bonds and gold benefiting on the back of worries about the global growth outlook. This note looks at the key issues.

    What is a trade war?

    A trade war is where countries raise barriers to trade with each other usually motivated by a desire to “protect” jobs often overlaid with “national security” motivations. To be a “trade war”, the barriers need to be significant in terms of their size and the proportion of imports covered. The best-known global trade war was that in 1930 which saw average 20% tariff hikes on US imports.

    What is so good about free trade?

    A basic concept in economics is comparative advantage: that if Country A and B are both equally good at making Product X but Country B is best at making Product Y then they will be best off if A makes X and B makes Y. Put simply, free trade leads to higher living standards and lower prices whereas restrictions on trade lead to lower living standards and higher prices.

    So why is President Trump raising tariffs then?

    It’s basically about fulfilling a presidential campaign commitment to “protect” American workers from what he regards as unfair trading practices in countries that the US has a trade deficit with – notably China. And he knows this is popular with his supporters but there is also some degree of bi-partisan support for taking on China.

    What does President Trump want?

    Basically, he wants China to lower its tariffs, allow better access for US companies, end US companies being forced to hand over their technologies and protect intellectual property of US companies. At a high level he wants a reduction in America’s trade deficit with China. Along the way he has renegotiated the NAFTA free trade agreement with Mexico and Canada and the free trade deal with South Korea and is in talks with Europe and Japan. In recent times he has also used the threat of tariffs to get what he wants from countries (eg Mexico in relation to border protection).

    Where are we now?

    Fears of a global trade war kicked off in March last year with Trump’s announcement of a 10% tariff on aluminium imports and a 25% tariff on steel imports. US allies were subsequently exempted but China was not. On March 22 Trump announced 25% tariffs on $US50bn of US imports from China. These were implemented in July and August. After Chinese retaliation Trump announced a 10% tariff on another $US200bn of imports from China (implemented in September) which would increase to 25% on January 1 this year. The latter was delayed as the talks made progress.

    However, following May 5 tweets by Trump, on May 10 the delayed tariff hike from 10% to 25% on $US200bn of imports from China was put in place and the US kicked off a process to tariff the remaining roughly $US300bn of imports from China at 25%. If fully implemented this would take the average US tariff rate on imports to around 7.5%, which is significant (albeit minor compared to the 20% 1930 tariff hikes). See next chart.

    Average weighted tariff rate across all products

    average weighted tariffs

    Source: World Bank, Deutsche Bank Research

    Along the way, China’s retaliation has been less than proportional, partly reflecting lower imports from the US. The US has also put in place restrictions on dealing with Chinese tech companies like Huawei.

    Following a meeting in late June between Presidents Trump and Xi the trade war was put on hold pending a third round of talks. These look to have made little progress and Trump announced last week that from September 1 the remaining $US300bn of imports from China will be taxed at 10% and this may go beyond 25%.

    China has responded by allowing the Renminbi to fall below 7 to the $US and reportedly ordering state-owned enterprises to halt imports of agricultural products from the US. The US then named China a currency manipulator (even though basic economics pointed to a fall in the Renminbi in response to the tariffs on its good) which opens the door to possibly further action by the US (eg intervention to lower the $US versus the Renminbi) and potentially a further escalation in the trade war.

    At the same time, the US is still considering auto tariffs after a report lodged in February.

    What happened to the US/China trade talks?

    This has been the third round of trade talks that look to have failed. The timing of the announcement of the latest round of tariffs may also reflect a desire by Trump to force the Fed to ease more as he wasn’t happy with its 0.25% cut last week and to show that he is tougher on trade than far-left Democrat presidential candidates Sanders and Warren. Whatever it is, there is likely to have been a further breakdown in trust between China and the US and China may have decided to wait till after the election.

    Ongoing tensions around North Korea, Iran, Hong Kong, Taiwan and the South China sea are probably not helping the issue either.

    What will be the economic impact?

    The latest round of tariff increases from September 1 would be a big deal compared to last year’s tariffs and see the impact shift to largely consumer goods as opposed to intermediate goods in the first tariff rounds. The 10% tariff could knock around 0.3% from US and Chinese GDP particularly as investment gets hit in response to uncertainty about supply chains. The full 25% tariff could take that to around 0.75% with roughly a 0.2% boost to US core inflation (albeit this would be temporary and looked through by the Fed). This would flow on to slower global growth and lead to less demand for Australia’s exports even though we are not directly affected.

    What is the most likely outcome?

    At this point, it’s hard to see a way out of the escalating trade war and it risks flowing into other issues as well including around HK, Taiwan, and the South China sea as the US and China slip further towards some sort of “cold war”. However, as the economic impact in the US mounts – so far it’s just been impacting business confidence and investment plans but risks impacting consumer spending too – President Trump is likely to become more concerned. Recessions and rising unemployment have historically killed the re-election of sitting presidents (Hoover, Ford, Carter and Bush senior) and for this reason, we remain of the view that a deal will be reached before the election. President Trump showed late last year that he was sensitive to the impact of the trade conflict on the US share market (as after sharp falls he called President Xi to set up a new meeting). So sharp share market falls may be needed again to get the US and China negotiating. But this means it could still get worse before it gets better – the US share market had a top to bottom fall last year of 20%!

    It’s also worth noting that policy stimulus by the Fed and the Chinese government will offset some of negative impact which along with the absence of the sort of excesses (like in cyclical spending, inflation and private debt) that normally precede recessions in the US is why we are not predicting a recession.

    What does it mean for investment markets?

    Basically, the uncertainty around the escalating trade war is bad for listed growth assets like shares as it threatens the outlook for growth and profits, but positive for safe-haven assets which is why bond yields in many countries including Australia have pushed further into record low territory and gold has increased in value.

    Following last week’s highs, global and Australian shares have fallen roughly 5-6%, mainly reflecting concern about the impact on growth from the escalating trade war. Further downside is likely in the short term as the trade war continues to escalate and we are also in a seasonally weak part of the year for shares. This is likely to be associated with further falls in bond yields.

    However, providing we are right and recession is avoided, a major bear market in shares (ie where shares fall 20% and a year later are down another 20% or so) is unlikely.

    What does it all mean for Australia?

    Fortunately, Australians aren’t having to pay higher taxes on imports like Americans, but the main risk is that we are indirectly affected as the US/China trade war drags down global growth, weighing on demand for our exports and leading to unemployment pushing higher than our 5.5% forecast for year end. This all adds to the case for further easing by the RBA (we expect the cash rate to fall to 0.5% by February) and for further fiscal stimulus.

    What should investors do?

    Times like the present are stressful for investors. No one likes to see their wealth fall and uncertainty seems very high. I don’t have a perfect crystal ball, so from the point of sensible long-term investing the following points are worth bearing in mind.

    • First, periodic sharp setbacks in share markets are healthy and normal as can be seen in the next chart. The setbacks are the price we pay for the higher long-term return from shares. After 25% or so gains from their lows, last December shares were at risk of a correction.

    share markets corrections

    Source: Bloomberg, AMP Capital

    • Second, selling shares or switching to a more conservative strategy after a major fall just locks in a loss. The best way to guard against selling on the basis of emotion is to adopt a well thought out, long-term investment strategy.
    • Third, when growth assets fall they are cheaper and offer higher long-term return prospects. So, the key is to look for opportunities that pullbacks provide. 
    • Fourth, while shares may be falling in value, the dividends from the market aren’t. The income flow you are receiving from a diversified portfolio of shares remains attractive.
    • Fifth, shares often bottom at the point of maximum bearishness. So, when everyone is negative and cautious it’s often time to buy.
    • Finally, turn down the noise on financial news. In periods of market turmoil, the flow of negative news reaches fever pitch, which makes it very hard to stick to a well-considered, long-term strategy, let alone see the opportunities.


    Not sure if your portfolio is on track?

    Making sure you have your portfolio organised to weather this volatile first half of the year is key, get in contact with us on 02 9328 0876.


    This article was prepared by Dr Shane Oliver. Dr Shane Oliver who provides economic forecasts and analysis of key variables and issues affecting, or likely to affect, all asset markets. He also provides economic forecasts and analysis of key variables and issues affecting, or likely to affect, all asset markets.

    Important note: While every care has been taken in the preparation of this document, AMP Capital Investors Limited (ABN 59 001 777 591, AFSL 232497) and AMP Capital Funds Management Limited (ABN 15 159 557 721, AFSL 426455) make no representations or warranties as to the accuracy or completeness of any statement in it including, without limitation, any forecasts. Past performance is not a reliable indicator of future performance. This document has been prepared for the purpose of providing general information, without taking account of any particular investor’s objectives, financial situation or needs. An investor should, before making any investment decisions, consider the appropriateness of the information in this document, and seek professional advice, having regard to the investor’s objectives, financial situation and needs. This document is solely for the use of the party to whom it is provided.

    This article contains information that is general in nature. It does not take into account the objectives, financial situation or needs of any particular person. You need to consider your financial situation and needs before making any decisions based on this information.

    Happy New Financial Year 2019!

     
    Bill discusses the effects on the stock market due to Trump’s trade war with China, the property market gaining momentum, and what to do (and what not to do) when interest rates are only 1%.


    Still have some questions?

    If you are seeking some financial advice in relation to your personal situation. Call us to arrange an appointment with one of our planners on 02 9328 0876.


    General Disclaimer: This video contains information that is general in nature. It does not take into account the objectives, financial situation or needs of any particular person. You need to consider your financial situation and needs before making any decisions based on this information. Please seek personal financial advice prior to acting on this information.

    SFP - 2018 Federal Budget Review

    2019 Federal Budget announces a $7.1 Billion suplus in next financial year

    SFP - 2018 Federal Budget Review


    Still have some questions or concerns?

    If you want to discuss the Federal Budget Review and how it may impact you specifically, arrange to speak with your SFP advisor. Call us to arrange an appointment on 02 9328 0876.


    General Disclaimer: This article and video contains information that is general in nature. It does not take into account the objectives, financial situation or needs of any particular person. You need to consider your financial situation and needs before making any decisions based on this information. Please seek personal financial advice prior to acting on this information.