Higher global inflation and higher bond yields
Introduction
Since the Global Financial Crisis (GFC) there have been a few occasions when many feared inflation was about to rebound and push bond yields sharply higher only to see growth relapse and deflationary concerns dominate.
As a result, expectations for higher inflation globally have been progressively squeezed out to the point that few seem to be expecting it. However, the global risks to inflation and bond yields are finally shifting to the upside, with investment markets starting to take note as evident in the pullback in global share markets seen over the last few days. But how big is the risk? Are we on the brink of another bond crash that will engulf other assets?
Inflation and bond yields – some context
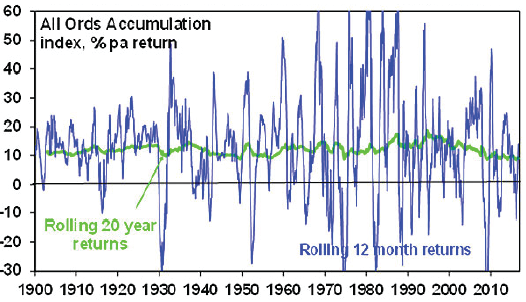
But first some context. In a big picture sense, inflation has been falling since the mid 1970s-early 1980s. The global economy is finally emerging from its post-Global Financial Crisis (GFC) hangover. Talk of secular stagnation was overdone. Slow global growth since the GFC largely reflected a typical constrained aftermath from a major financial crisis.
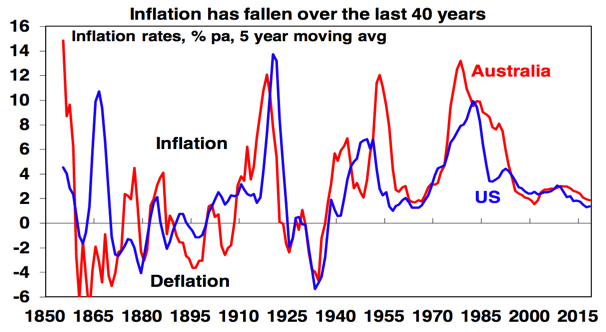
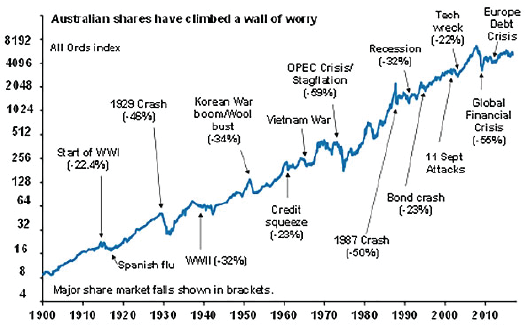
Source: Global Financial Data, AMP Capital
The fall in inflation over the last 30-40 years reflects: the inflation-fighting policies of central banks; supply side reforms that boosted productivity; globalisation that brought a billion or so workers into the capitalist system; and the benefits of the information technology revolution harnessed by the likes of Amazon and Uber. The fall in inflation in turn has been the main driver of a super cycle bull market in bonds, with yields trending down since the early 1980s. (Don’t forget, when bond yields fall, bond prices rise. Suppose the government issues a $100 bond paying $4 pa in interest for an initial yield of 4%. If investors push yields down to 3%, the bond’s price will be pushed up until the 3% yield is achieved with the $4 interest payment.)
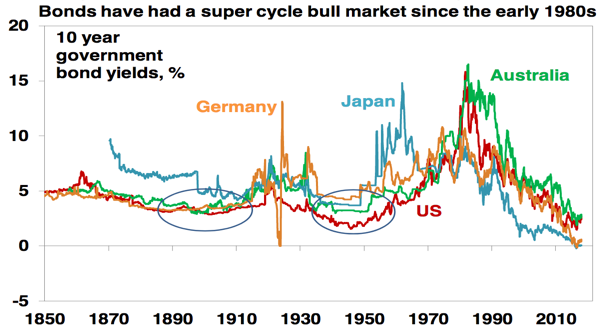
Source: Global Financial Data, AMP Capital
The collapse in bond yields into 2016 was accentuated by: worries about deflation; investors extrapolating very low official interest rates; worries economic growth will remain slow; safe-haven investor demand for bonds in response to geopolitical concerns and the experience that bonds always rally when shares fall; an increasing demand for income-yielding assets as populations age; and a shortage in the supply of bonds as budget deficits fell when central banks have been buying bonds. But the main driver since the early 1980s has been the fall in inflation.
Inflation and other assets
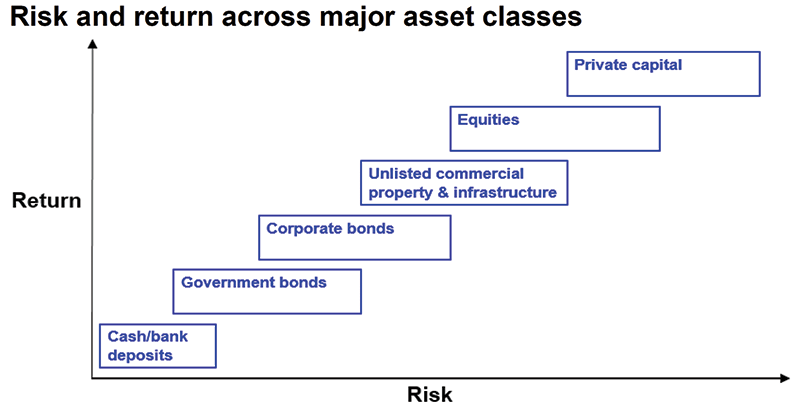
The 35-40-year fall in inflation and bond yields has also underpinned strong gains in most other assets. Put simply:
- the shift to lower in inflation allowed interest rates
to fall; - this allowed bond yields to fall (resulting in capital gains);
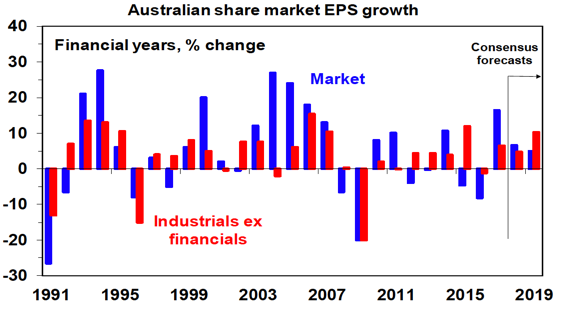
- which in turn allowed shares to be rerated higher (price to earnings multiples rose from around seven or eight times in the early 1980s to around 15-17 times), which boosted share returns over and above what would have been expected from dividend yieldsand earnings growth alone;
- lower interest rates allowed other assets to trade on lower yields boosting both commercial property returns, house prices and infrastructure returns. In
particular, residential property gained as lower mortgage rates allowed people to borrow more relative to their incomes.
Inflation starting to stir globally, bond yields on the up
Since late 2016, our assessment has been that the super cycle bull market in bonds is over. This remains the case for several reasons. First, deflation risks are receding and gradually giving rise to inflation risks, led by the US:
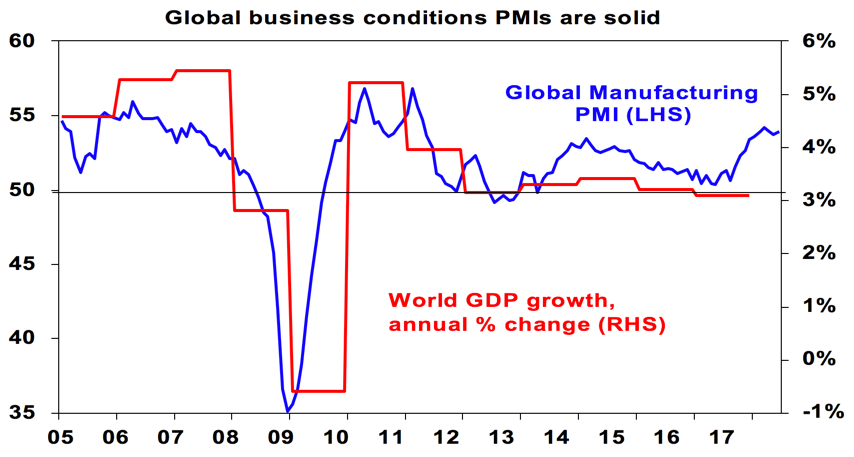
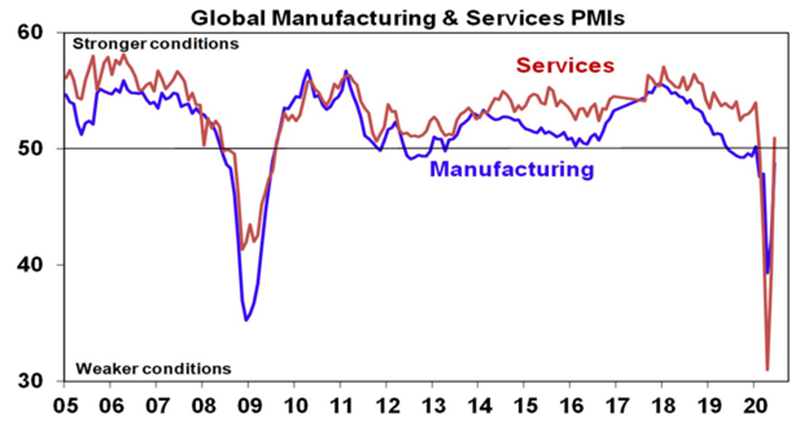
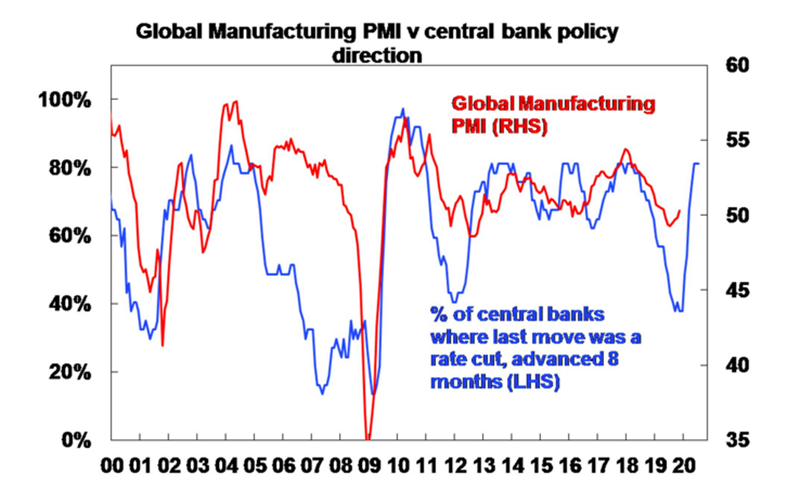
- Global growth is now starting to run above potential again and this is leading to a decline in spare capacity and with global growth now accelerating this is likely to have been used up by late next year. Diminishing spare capacity makes it easier for companies to raise prices.
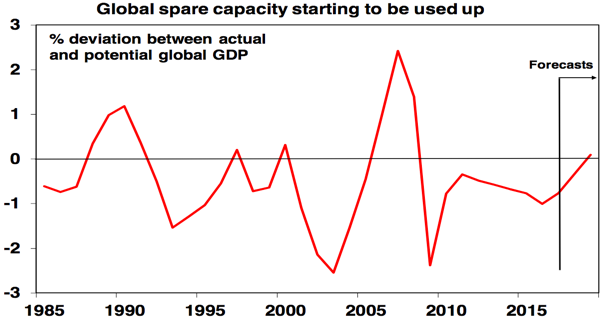
Source: IMF, AMP Capital
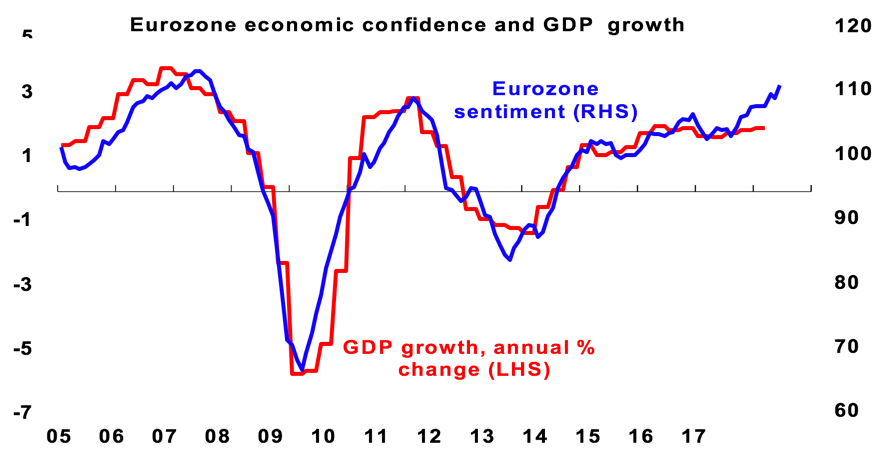
- While Europe, Japan and Australia are lagging (as evident in still low inflation readings recently), the US economy is likely around full capacity evident in unemployment around 4%, increasing anecdotes of labour shortages and rising wages and business surveys pointing to rising selling prices. This will likely drive 4 (or possibly 5) Fed hikes this year whereas the market is only allowing for 2 or 3, with the Fed’s January meeting indicating a bit more hawkishness.
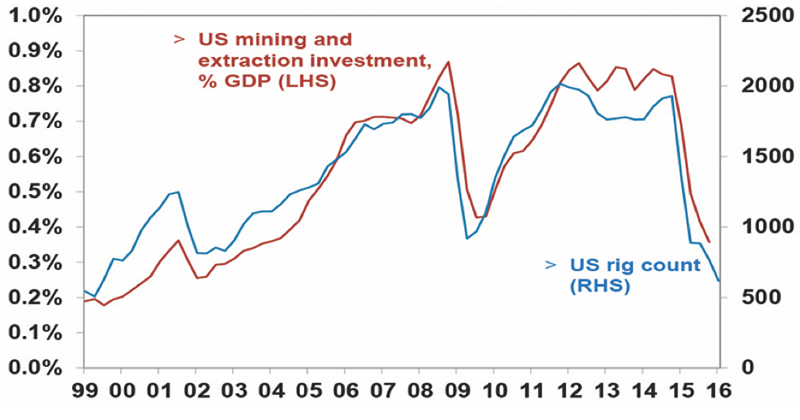
- Commodity prices are rising most notably oil, which will at least boost headline inflation.
- Second, this is occurring when bond yields remain well below levels consistent with likely long-term nominal growth (see the next table). Over the long-term, nominal bond yields tend to average around long-term nominal GDP growth.
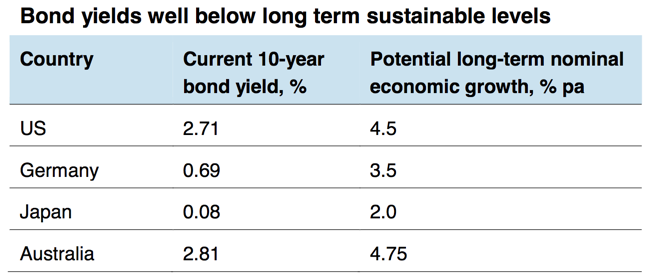
Source: Bloomberg, AMP Capital
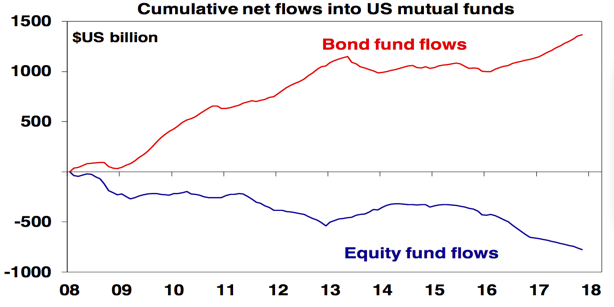
Source: ICI, AMP Capital
- Thirdly, bonds remain over loved with a huge post-GFC inflow into bond funds in the US. (The same picture applies if ETFs are added in.) This leaves them vulnerable to a reversal if investor sentiment towards them turns really negative.
Finally, central bank buying of bonds is starting to slow.
For these reasons, it’s likely that the upswing in bond yields that began in the second half 2016, then paused last year and has since resumed, will continue.
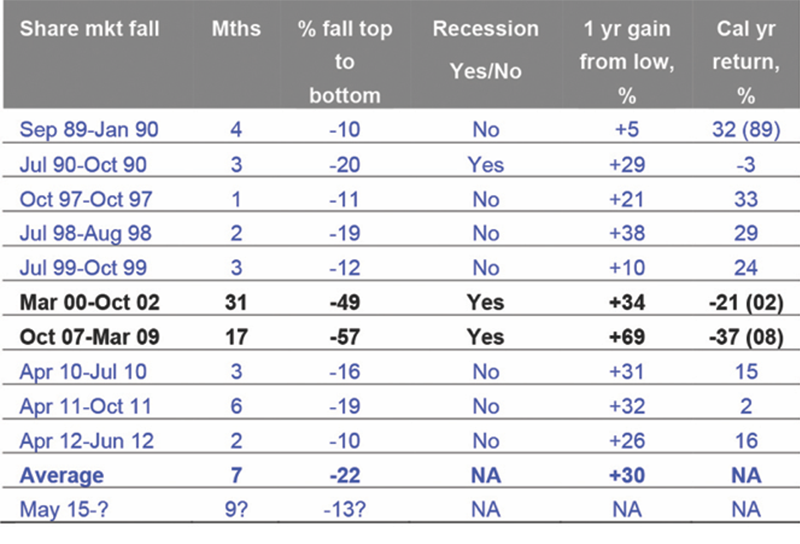
Reasons bond crash/perfect storm fears are overdone
Naturally as falling inflation gives way to rising inflation and bond yields head higher many assume the worst – such as a
rerun of the 1994 mini bond crash or some sort of “perfect storm” where inflation takes off but central banks are powerless to stop it because high debt levels mean they can’t raise rates much. While we see bond yields rising, it’s likely to be gradual (like over the last 18 months) and a perfect storm is unlikely:
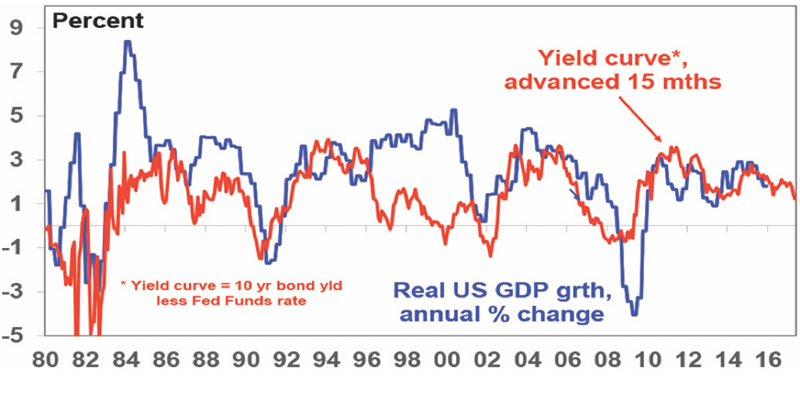
- Historically, bond yields have remained low after a long-term downswing for around several years as it takes a while for growth and inflation expectations to
really turn back up. See the circled areas for US and Australian bond yields in the second chart in this note. - While the Fed is likely to raise interest rates more than
currently expected by the US money market (we expect four hikes and the market is factoring in two or three), the process of rate hikes is still likely to remain gradual. - Central banks in Europe, Japan and Australia remain
a fair way off starting to tighten so global monetary policy will remain easy for a while yet. - Global inflation is unlikely to take off too quickly given spare capacity in labour markets (in Europe and Australia) and technological innovation continuing to constrain inflation.Inflation expectations are anchored at low levels far better than was the case in, say, 1994.
- Finally, the idea that high debt levels mean that central banks will either have to live with a debt crisis or much higher inflation is nonsense. High debt levels just mean that interest rate increases are more potent than they used to be – so when inflation does start to become an issue, they won’t have to raise interest rates as much to bring spending and inflation back under control than was the case in the past. In fact, high debt levels mean central banks have more power than in the past to control inflation.
Implications for Investors?
There are several implications from rising bond yields. Firstly, expect mediocre returns from sovereign bonds. Over the medium term, the return an investor will get from a bond will basically be driven by what the yield was when they invested. 10-year bond yields of 2.8% in Australia imply bond returns over the next decade of just 2.8% or so! And in the short term, rising bond yields will mean capital loses.
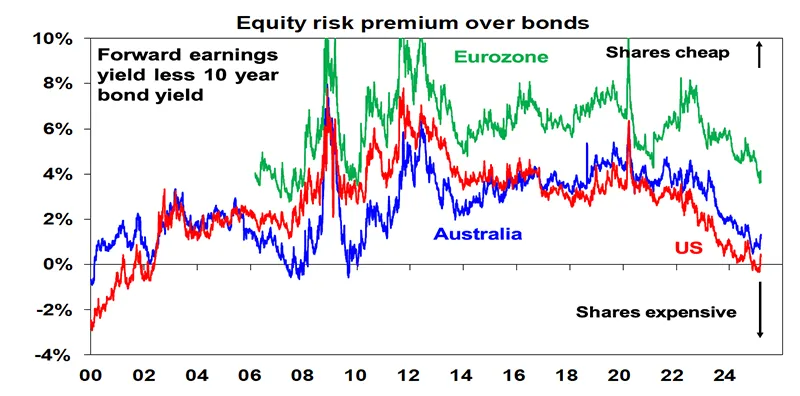
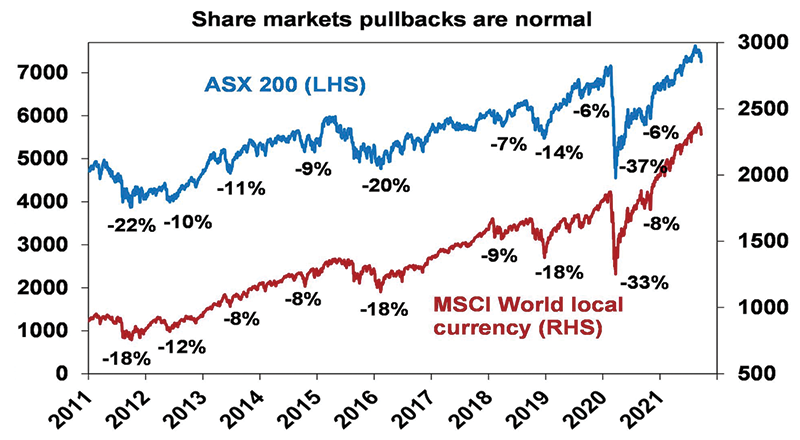
Secondly, higher bond yields will impact share market returns as they make shares more expensive. Shares will be okay if the rise in bond yields is gradual and so can be offset by rising earnings – as we expect this year – but a large abrupt back up in bond yields will be more of a concern. In any case expect a more volatile ride in shares.
Thirdly, defensive high-yield sectors of the share market are likely to remain under pressure. This includes real estate investment trusts and utilities that benefitted from falling bond yields. With bond yields trending up, REITs and utilities are likely to remain relative underperformers.
Fourthly, when it comes to real assets like unlisted commercial property and unlisted infrastructure, the search for yield is likely to remain a return driver unless bond yields rise aggressively. Commercial property has lagged listed property in responding to the decline in bond yields and so
the gap between commercial property yields and bond yields leaves commercial property still looking attractive. Heading into the GFC, it was only when bond yields rose above commercial property yields that commercial property prices started to struggle. We are a long way from that but as bond yields trend higher the valuation boost to commercial property and infrastructure returns will gradually fade.
Concluding comment
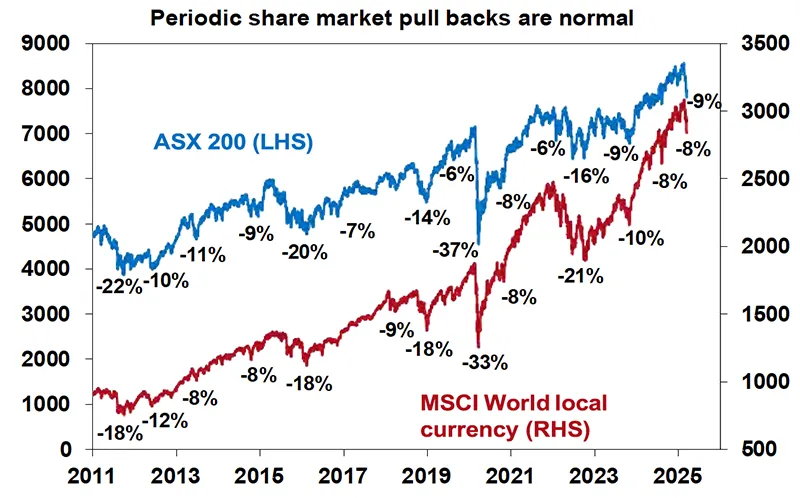
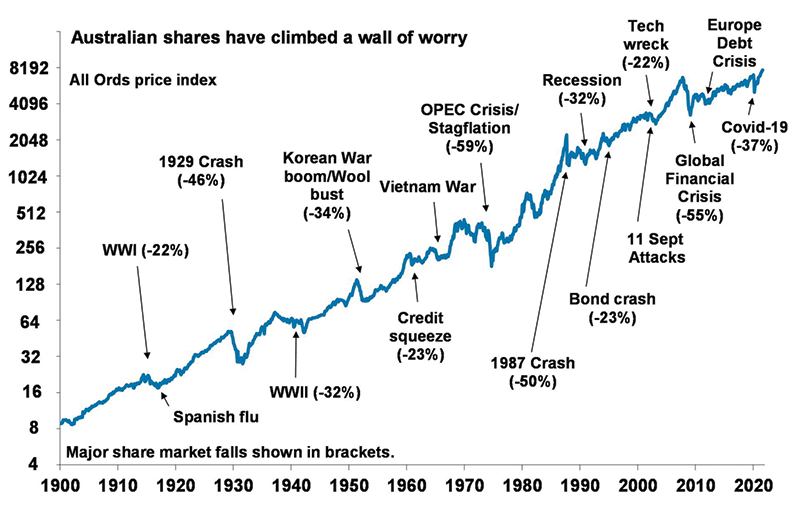
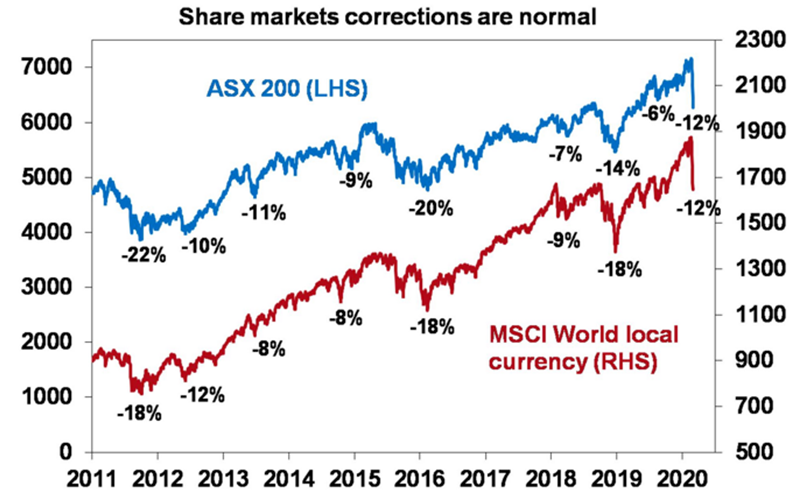
After 7 years of positive gains averaging higher than usual returns mixed with low volubility, it looks like a change is upon us. Volatility is the price we pay for gaining a higher return. Now with interest rates slowly increasing, we can expect to see more volatility moving forward. The main point is don’t freak out! It’s normal. I’ve been advising for 30 years now and seen this many times before. As unpleasant as it can be to see your investments go up and down on a weekly basis, this is completely normal – because this is what financial markets just do. The key takeaway is don’t panic, and in fact it may be an advantage to go and buy assets for cheaper. Personally, I’ve been topping up my own super and investments, taking advantage of lower prices. So if you’re still freaking out after reading all this, I urge you to call your Financial Planner and see what strategy you have in place to manage this. A well-managed, well diversified and well advised strategy is the key.
That’s our job. 2018 here we go!
Bill Bracey – FChFP | Principal Sydney Financial Planning
Authorised Representative Charter Financial Planning
Do you still have some questions?
If you want to discuss your investment strategy or impacts of current trends with one of our advisors. Call us to arrange an appointment on 02 9328 0876.
This article was prepared by Dr Shane Oliver. Dr Shane Oliver, Head of Investment Strategy and Economics and Chief Economist at AMP Capital is responsible for AMP Capital’s diversified investment funds. He also provides economic forecasts and analysis of key variables and issues affecting, or likely to affect, all asset markets.
Important note: While every care has been taken in the preparation of this document, AMP Capital Investors Limited (ABN 59 001 777 591, AFSL 232497) and AMP Capital Funds Management Limited (ABN 15 159 557 721, AFSL 426455) make no representations or warranties as to the accuracy or completeness of any statement in it including, without limitation, any forecasts. Past performance is not a reliable indicator of future performance. This document has been prepared for the purpose of providing general information, without taking account of any particular investor’s objectives, financial situation or needs. An investor should, before making any investment decisions, consider the appropriateness of the information in this document, and seek professional advice, having regard to the investor’s objectives, financial situation and needs. This document is solely for the use of the party to whom it is provided.
General Disclaimer: This article contains information that is general in nature. It does not take into account the objectives, financial situation or needs of any particular person. You need to consider your financial situation and needs before making any decisions based on this information. Please seek personal financial advice prior to acting on this information.