
Tag: Economic Outlook

SFP - 2018 Federal Budget Review

SFP – 2018 Federal Budget Review

SFP - 2018 Federal Budget Review


Still have some questions?

If you want to discuss the Federal Budget Review and how it may impact you specifically, arrange to speak with your SFP advisor. Call us to arrange an appointment on 02 9328 0876.


General Disclaimer: This article and video contains information that is general in nature. It does not take into account the objectives, financial situation or needs of any particular person. You need to consider your financial situation and needs before making any decisions based on this information. Please seek personal financial advice prior to acting on this information.


Higher global inflation

Higher global inflation and higher bond yields

Higher global inflation

  • Higher US inflation and a more aggressive Fed will likely boost volatility this year. However, the back-up in bond yields is likely to remain relatively gradual, and other countries including Australia will lag the US
  • Introduction

    Since the Global Financial Crisis (GFC) there have been a few occasions when many feared inflation was about to rebound and push bond yields sharply higher only to see growth relapse and deflationary concerns dominate.

    As a result, expectations for higher inflation globally have been progressively squeezed out to the point that few seem to be expecting it. However, the global risks to inflation and bond yields are finally shifting to the upside, with investment markets starting to take note as evident in the pullback in global share markets seen over the last few days. But how big is the risk? Are we on the brink of another bond crash that will engulf other assets?

    Inflation and bond yields – some context

    But first some context. In a big picture sense, inflation has been falling since the mid 1970s-early 1980s. The global economy is finally emerging from its post-Global Financial Crisis (GFC) hangover. Talk of secular stagnation was overdone. Slow global growth since the GFC largely reflected a typical constrained aftermath from a major financial crisis.

    AU Inflation Past 40 Years

    Source: Global Financial Data, AMP Capital


    The fall in inflation over the last 30-40 years reflects: the inflation-fighting policies of central banks; supply side reforms that boosted productivity; globalisation that brought a billion or so workers into the capitalist system; and the benefits of the information technology revolution harnessed by the likes of Amazon and Uber. The fall in inflation in turn has been the main driver of a super cycle bull market in bonds, with yields trending down since the early 1980s. (Don’t forget, when bond yields fall, bond prices rise. Suppose the government issues a $100 bond paying $4 pa in interest for an initial yield of 4%. If investors push yields down to 3%, the bond’s price will be pushed up until the 3% yield is achieved with the $4 interest payment.)


    Bonds Super Cycle

    Source: Global Financial Data, AMP Capital

    The collapse in bond yields into 2016 was accentuated by: worries about deflation; investors extrapolating very low official interest rates; worries economic growth will remain slow; safe-haven investor demand for bonds in response to geopolitical concerns and the experience that bonds always rally when shares fall; an increasing demand for income-yielding assets as populations age; and a shortage in the supply of bonds as budget deficits fell when central banks have been buying bonds. But the main driver since the early 1980s has been the fall in inflation.

    Inflation and other assets

    The 35-40-year fall in inflation and bond yields has also underpinned strong gains in most other assets. Put simply:

    • the shift to lower in inflation allowed interest rates
      to fall;
    • this allowed bond yields to fall (resulting in capital gains);
    • which in turn allowed shares to be rerated higher (price to earnings multiples rose from around seven or eight times in the early 1980s to around 15-17 times), which boosted share returns over and above what would have been expected from dividend yieldsand earnings growth alone;
    • lower interest rates allowed other assets to trade on lower yields boosting both commercial property returns, house prices and infrastructure returns. In
      particular, residential property gained as lower mortgage rates allowed people to borrow more relative to their incomes.

    Inflation starting to stir globally, bond yields on the up

    Since late 2016, our assessment has been that the super cycle bull market in bonds is over. This remains the case for several reasons. First, deflation risks are receding and gradually giving rise to inflation risks, led by the US:

    • Global growth is now starting to run above potential again and this is leading to a decline in spare capacity and with global growth now accelerating this is likely to have been used up by late next year. Diminishing spare capacity makes it easier for companies to raise prices.

    Bonds Super Cycle

    Source: IMF, AMP Capital

    • While Europe, Japan and Australia are lagging (as evident in still low inflation readings recently), the US economy is likely around full capacity evident in unemployment around 4%, increasing anecdotes of labour shortages and rising wages and business surveys pointing to rising selling prices. This will likely drive 4 (or possibly 5) Fed hikes this year whereas the market is only allowing for 2 or 3, with the Fed’s January meeting indicating a bit more hawkishness.

    • Commodity prices are rising most notably oil, which will at least boost headline inflation.

    • Second, this is occurring when bond yields remain well below levels consistent with likely long-term nominal growth (see the next table). Over the long-term, nominal bond yields tend to average around long-term nominal GDP growth.

    Bonds Yeild

    Source: Bloomberg, AMP Capital


    US Mutual Funds

    Source: ICI, AMP Capital

    • Thirdly, bonds remain over loved with a huge post-GFC inflow into bond funds in the US. (The same picture applies if ETFs are added in.) This leaves them vulnerable to a reversal if investor sentiment towards them turns really negative.

    Finally, central bank buying of bonds is starting to slow.

    For these reasons, it’s likely that the upswing in bond yields that began in the second half 2016, then paused last year and has since resumed, will continue.

    Reasons bond crash/perfect storm fears are overdone

    Naturally as falling inflation gives way to rising inflation and bond yields head higher many assume the worst – such as a
    rerun of the 1994 mini bond crash or some sort of “perfect storm” where inflation takes off but central banks are powerless to stop it because high debt levels mean they can’t raise rates much. While we see bond yields rising, it’s likely to be gradual (like over the last 18 months) and a perfect storm is unlikely:

    • Historically, bond yields have remained low after a long-term downswing for around several years as it takes a while for growth and inflation expectations to
      really turn back up. See the circled areas for US and Australian bond yields in the second chart in this note.
    • While the Fed is likely to raise interest rates more than
      currently expected by the US money market (we expect four hikes and the market is factoring in two or three), the process of rate hikes is still likely to remain gradual.
    • Central banks in Europe, Japan and Australia remain
      a fair way off starting to tighten so global monetary policy will remain easy for a while yet.
    • Global inflation is unlikely to take off too quickly given spare capacity in labour markets (in Europe and Australia) and technological innovation continuing to constrain inflation.Inflation expectations are anchored at low levels far better than was the case in, say, 1994.
    • Finally, the idea that high debt levels mean that central banks will either have to live with a debt crisis or much higher inflation is nonsense. High debt levels just mean that interest rate increases are more potent than they used to be – so when inflation does start to become an issue, they won’t have to raise interest rates as much to bring spending and inflation back under control than was the case in the past. In fact, high debt levels mean central banks have more power than in the past to control inflation.

    Implications for Investors?

    There are several implications from rising bond yields. Firstly, expect mediocre returns from sovereign bonds. Over the medium term, the return an investor will get from a bond will basically be driven by what the yield was when they invested. 10-year bond yields of 2.8% in Australia imply bond returns over the next decade of just 2.8% or so! And in the short term, rising bond yields will mean capital loses.

    Secondly, higher bond yields will impact share market returns as they make shares more expensive. Shares will be okay if the rise in bond yields is gradual and so can be offset by rising earnings – as we expect this year – but a large abrupt back up in bond yields will be more of a concern. In any case expect a more volatile ride in shares.

    Thirdly, defensive high-yield sectors of the share market are likely to remain under pressure. This includes real estate investment trusts and utilities that benefitted from falling bond yields. With bond yields trending up, REITs and utilities are likely to remain relative underperformers.

    Fourthly, when it comes to real assets like unlisted commercial property and unlisted infrastructure, the search for yield is likely to remain a return driver unless bond yields rise aggressively. Commercial property has lagged listed property in responding to the decline in bond yields and so
    the gap between commercial property yields and bond yields leaves commercial property still looking attractive. Heading into the GFC, it was only when bond yields rose above commercial property yields that commercial property prices started to struggle. We are a long way from that but as bond yields trend higher the valuation boost to commercial property and infrastructure returns will gradually fade.

    Concluding comment

    After 7 years of positive gains averaging higher than usual returns mixed with low volubility, it looks like a change is upon us. Volatility is the price we pay for gaining a higher return. Now with interest rates slowly increasing, we can expect to see more volatility moving forward. The main point is don’t freak out! It’s normal. I’ve been advising for 30 years now and seen this many times before. As unpleasant as it can be to see your investments go up and down on a weekly basis, this is completely normal – because this is what financial markets just do. The key takeaway is don’t panic, and in fact it may be an advantage to go and buy assets for cheaper. Personally, I’ve been topping up my own super and investments, taking advantage of lower prices. So if you’re still freaking out after reading all this, I urge you to call your Financial Planner and see what strategy you have in place to manage this. A well-managed, well diversified and well advised strategy is the key.

    That’s our job. 2018 here we go!

    Bill Bracey – FChFP | Principal Sydney Financial Planning
    Authorised Representative Charter Financial Planning


    Do you still have some questions?

    If you want to discuss your investment strategy or impacts of current trends with one of our advisors. Call us to arrange an appointment on 02 9328 0876.


    This article was prepared by Dr Shane Oliver. Dr Shane Oliver, Head of Investment Strategy and Economics and Chief Economist at AMP Capital is responsible for AMP Capital’s diversified investment funds. He also provides economic forecasts and analysis of key variables and issues affecting, or likely to affect, all asset markets.

    Important note: While every care has been taken in the preparation of this document, AMP Capital Investors Limited (ABN 59 001 777 591, AFSL 232497) and AMP Capital Funds Management Limited (ABN 15 159 557 721, AFSL 426455) make no representations or warranties as to the accuracy or completeness of any statement in it including, without limitation, any forecasts. Past performance is not a reliable indicator of future performance. This document has been prepared for the purpose of providing general information, without taking account of any particular investor’s objectives, financial situation or needs. An investor should, before making any investment decisions, consider the appropriateness of the information in this document, and seek professional advice, having regard to the investor’s objectives, financial situation and needs. This document is solely for the use of the party to whom it is provided.

    General Disclaimer: This article contains information that is general in nature. It does not take into account the objectives, financial situation or needs of any particular person. You need to consider your financial situation and needs before making any decisions based on this information. Please seek personal financial advice prior to acting on this information.

    54.2 million worries

    54.2 million worries – five ways to help manage the noise

    54.2 million worries

    To be sure these risks are real and in our view some combination of them could drive a short term correction in shares, but we don’t see them derailing the longer term rising trend in shares.

    More fundamentally there seems to be a never ending worry list which is receiving an ever higher prominence as the information age enables the ready and rapid dissemination of news, opinion and noise. The danger is that this is making us all worse investors as we lurch from one worry to the next resulting in ever shorter investment horizons in the process. The trick is how to manage the noise to avoid this.

    Why the worries might seem more worrying?

    The problem for investors is that the worry list seems more worrying than it used to be. Yes, there is a fundamental element: the nominal return potential from most asset classes are lower than they used to be, global growth is slower than it was pre GFC and the world seems awash in geopolitical risks.

    But there is a huge psychological aspect to this that is combining with the increasing availability of information, and intensifying competition amongst various forms of media for clicks, that is magnifying perceptions around various worries.

    Firstly, people suffer from a behavioural trait that has become known as “loss aversion” in that a loss in financial wealth is felt much more distastefully than the beneficial impact of the same sized gain. This probably reflects the evolution of the human brain in the Pleistocene age when the trick was to avoid being eaten by a sabre toothed tiger or squashed by a wholly mammoth. This leaves us biased to be more risk averse and it also leaves us more predisposed to bad news stories as opposed to good news stories. Flowing from this, prognosticators of gloom are more likely to be revered as deep thinkers than are optimists. As John Stuart Mill noted “I have observed that not the man who hopes when others despair, but the man who despairs when others hope, is admired by a large class of persons as a sage.” In other words bad news and doom and gloom find a more ready market than good news or balanced commentary as it appeals to our instinct to look for risks around the corner. Hence the old saying “bad new sells”.

    Secondly, we are now exposed to more information than ever on both how our investments are going and everything else. On the one hand this is great – we can check facts, analyse things, sound informed easier than ever. But for the most part we have no way of weighing such information and no time to do so. So it becomes noise. This comes with a cost for investors. If we don’t have a process to filter it and focus on what matters we can simply suffer from information overload. This can be bad for investors as when faced with more (and often bad) news we can freeze up and make the wrong decisions with our investment as our natural “loss aversion” combines with what is called the “recency bias” that sees people give more wait to recent events which can see investors project recent bad news into the future and so sell after a fall. A 1997 study by US behavioural economist Richard Thaler and others showed that providing investors in an experiment “with frequent feedback about their [investment] outcome is likely to encourage their worst tendencies…More is not always better. The subjects with the most data did the worst in terms of money earned.”

    Thirdly, there is explosion in media outlets all competing for your eyes and ears. We are now bombarded with economic and financial news and opinions with 24/7 coverage by multiple web sites, subscription services, finance updates, dedicated TV and on line channels etc. And in competing for your attention, bad news and gloom naturally trumps good news and balanced commentary as “bad news sells.” So naturally it seems that the bad news is “badder” and the worries more worrying than ever.

    Google the words “financial crisis 2016” and you get 54.2 million search results with titles such as:

    • “the looming financial crisis nobody is talking about…”;
    • “the pieces are falling into place for another financial crisis”;
    • “7 signs of a US economic collapse in 2016”;
    • “coming financial collapse – 18 critical items you need to prepare, tomorrow may be too late”;
    • “beware the great 2016 financial crisis”;
    • “looking for economic crisis 2016? Find everything you need here”;
    • “Trouble with money? The Bible has answers for you”; and
    • The Illuminati (are those guys still around?) are supposedly behind the “global financial crisis 2016-2017”.

    The trouble is that there is no evidence that all this noise is making us better investors. Average returns are no higher than in the past. A concern is that the combination of a massive ramp up in 2 NOVEMBER 2016 EDITION 2 information combined with our natural inclination to zoom in on negative news is making us worse investors: more fearful, more jittery and more short term focussed.

    Nine keys for successful investing

    There are nine keys to successful investing (see http://bit. ly/1JmaIDU): 1. Make the most of the power of compound interest; 2. Be aware that there is always a cycle; 3. Invest for the long term; 4. Diversify; 5. Turn down the noise; 6. Buy low and sell high; 7. Beware the crowd at extremes; 8. Focus on investments offering sustainable cash flow; and 9. Seek advice. But of all of these, number 5 – or turn down the noise on the information flow around us, is critical – if you can’t do that there is no point getting advice, you won’t be a long term investor, you won’t get the benefit of compound interest, you will be sucked into selling low in every cyclical downturn, etc.

    Five ways to manage the perpetual worry list

    So here are five suggestions as to how to manage the worry list and turn down the noise:

    Firstly, put the latest worry list in context. Remember that there has always been an endless stream of worries. Here’s a list of the worries of the last four years that have weighed on markets: the fiscal cliff; Cyprus; Fed taper talk; the US Government shutdown and debt ceiling debacle; Ukraine; IS terror threat; Ebola; deflation; Greece; China worries; Australian recession, property & banks; Brazil and Russia in recession; energy producers defaulting; manufacturing slump; Trump; worries about the Fed raising rates; soft starts to the year for US growth; falling profits; Brexit and contagion to the rest of Europe; North Korea; messy Australian election result; and South China Sea tensions.

    Australian shares have climbed a wall of worry

    sfp e2 graph 1

    Source: ASX, AMP Capital


    Yet despite this extensive worry list investment returns have actually been okay with average balanced growth superannuation funds returning 9.6% pa over the last four years and 7.4% pa over the last three years after taxes and fees.

    The global economy has had plenty of worries over the last century, but it got over them with Australian shares returning 11.6% pa since 1900 and US shares 9.8%pa.

    Secondly, recognise how markets work. A diverse portfolio of shares returns more than bonds and cash long term because it can lose money short term. As can be seen in the chart below while the share market can be highly volatile in the short term it has strong returns over all rolling 20 year periods. And invariably the short term volatility is driven by “loss averse” investors projecting recent events into the future and so causing shares to periodically from long term fundamental value. So volatility driven by worries and bad news is normal. It’s the price investors pay for higher longer term returns.

    Australian share returns over rolling 12 mth and 20 yr periods

    sfp e2 graph 2

    Source: Global Financial Data, AMP Capital

    Thirdly, find a way to filter news so that it doesn’t distort your investment decisions. For example this could involve building your own investment process or choosing 1-3 good investment subscription services and relying on them. Or simpler still, agreeing to a long term strategy with a financial planner and sticking to it. Ultimately it all depends on how much you want to be involved in managing your investments.


    Fourthly, make a conscious effort not to check your investments so much. If you track the daily movements in the Australian All Ords price index, measured over the last twenty years it has been down almost as much as it has been up. See the next chart. It’s little different for the US S&P 500. So day to day it’s pretty much a coin toss as to whether you will get good news or bad. By contrast if you only look at how the share market has gone each month and allow for dividends the historical experience tells us you will only get bad news 35% of the time. Looking only on a calendar year basis, data back to 1900 indicates that the probability of bad news in the form of a loss slides further to just 19% for Australian shares and 27% for US shares. And if you can stretch it out to once a decade, again since 1900, positive returns have been seen 100% of the time for Australian shares and 82% of the time for US shares.

    Percentage of positive share market returns

    sfp e2 graph 3

    Data from 1995 and 1900. Source: Global Financial Data, AMP Capital

    The less frequently you look the less you will be disappointed and so the lower the chance that a bout of “loss aversion” will be triggered which leads you to sell at the wrong time. Try to avoid looking at market updates so regularly and even consider removing related apps from your smart phones & tablets.

    Finally, look for opportunities that bad news and investor worries throw up. Always remember that periods of share market turbulence after bad news throw up opportunities for investors as such periods push shares into cheap territory.


    About the Author Dr Shane Oliver, Head of Investment Strategy and Economics and Chief Economist at AMP Capital is responsible for AMP Capital’s diversified investment funds. He also provides economic forecasts and analysis of key variables and issues affecting, or likely to affect, all asset markets.

    Concluding comment

    This article written by Dr Shane Oliver clearly demonstrates how we should act in the face of fear.

    I’m now aged 54. I started investing in the share market when I was 12 and at that age thought I knew what I was doing. By the time I was 24 I was certain I knew what I was doing when it came to investing. Then came October 1987 which convinced me I didn’t know what I was doing.

    So after the crash of 1987, some 29 years ago I started my path in Financial Planning. And, after watching and learning the markets for over 41 years, I can now confidently say I’m in a position to give great advice.

    In short, you need to work with an experienced Planner who can sift through all the bullshit and clearly explain what is going on and the actions required for you to build and retain wealth.

    The first step is to call us at Sydney Financial Planning. The second is to have an ongoing working relationship with your planner to ensure you don’t fail. If you are not a client yet, call us for an initial no obligation appointment.

    If you are an existing client, keep doing what you’re doing.


    Still have some questions?

    If you want to discuss your income strategy or side gig idea with one of our advisors. Call us to arrange an appointment on 02 9328 0876.


    Article by Bill Bracey | Senior Financial Planner


    General Disclaimer: This article contains information that is general in nature. It does not take into account the objectives, financial situation or needs of any particular person. You need to consider your financial situation and needs before making any decisions based on this information. Please seek personal financial advice prior to acting on this information.


    World Economy

    What’s Really Going on in the World Economically

    World Economy

    So what’s really happening in in the economy?

    Global economic data was largely positive in August as the post-Brexit recovery continued. In the main, economic data showed signs of stabilising and surprising to the upside, pointing towards continued, gradual economic growth.

    China‘s economic data was also better than expected in August, supporting the view that the economic growth has stabilised at about 7%. Industrial production, power consumption, retail sales, investment and growth in credit all notched higher.

    In the UK, the Bank of England left monetary policy on hold while in Europe, the industrial production made a reasonable comeback from declines in July.

    US economic data was soft as retail sales and industrial came in weaker than expected and small business confidence edged lower. However, the soft tone may well reduce the likelihood of a US rate rise, reducing some of the uncertainty deeply disliked by markets everywhere.

    In Australia, business confidence was up although jobs data were mixed. However, Australia has a seldom-discussed positive in its corner. Amid global concerns of developed economies running out of monetary policy rope, the Reserve Bank has never resorted to quantitative easing, yet still, has 1.5% up its sleeve.

    So in short, although there is constant volatility, things seem to be getting a little better around the world, and the share markets generally seem reasonably good value.


    Still have some questions?

    If you want to discuss your investment portfolio with one of our advisors. Call us to arrange an appointment on 02 9328 0876.


    General Disclaimer: This article contains information that is general in nature. It does not take into account the objectives, financial situation or needs of any particular person. You need to consider your financial situation and needs before making any decisions based on this information. Please seek personal financial advice prior to acting on this information.

    Zen of a market crash

    Zen of a market crash

    Zen of a market crash

    The mainstream media loves a “crash”, but let’s think through what actually happens…

    What I’d like you to get out of this blog post is to love market corrections … welcome them, see why they have to happen, how little they mean in the long run and how much advantage you have over them – if you only process them the right way.”

    The difference between the mind of a victim and the mind of an opportunist

    First of all, let’s start calling things by their real names.

    A crash is something definite, irreversible. Planes crash … cars crash. Markets don’t crash… markets correct. Their permanent growth is randomly interrupted by temporary declines. (Please notice the use of the adjective temporary). These happen often for no apparent reason, we can’t predict exactly when they happen and why? And guess what?! We don’t have to.

    Let me tell you a story…There is an old Zen parable that speaks of two monks; sitting on a hill, watching a flapping pennant in the wind.

    The first monk says: ‘The pennant is moving, the wind is not moving’.

    The other monk says: ‘No, it’s the wind that is moving, the pennant is not moving’.

    A third monk happens to walk by and he overhears the conversation.  He turns his head and says to his friends: ‘The pennant is not moving…the wind is not moving. Your minds are moving….’

    This parable precisely describes what happens during a market correction.


    You see, what actually happens in the market itself is infinitely less important than the following two things: 

    ‘How surprised people get’ and ‘What they think is going on’.

    And although the market correction is not predictable or controllable in any scientific way, these two things influence the way your ‘mind moves’ and are both totally predictable and controllable and I will argue also avoidable.

    1. The element of surprise

    It wasn’t that the market went down 50% between 2008 and 2009 that mattered.  What really mattered was how it surprised many… how unprepared and shocked many people were when it happened.

    We, humans, love fairy tales.  When we experience good time, we want it to last.  Sometimes, we want it so badly, that soon, we start believing that it’s not going to stop.

    When we look at the events prior to the GFC (or the Great Panic), a few years of consistent and smooth double digit returns in the market, we simply slipped into this state of a false comfort.  The minute you bought into this fiction of the ‘new era’ and you presumed that the market would only go up from that point onwards, there was no way you’d be ready for the market to come down 50%.

    Of course, the market didn’t go down any more or less for you than it did for anybody else. The difference was – it caught you by surprise, which prevented you from dealing with it calmly, making sense of it all and having a ‘battle plan’ (which is largely a psychological battle plan) for waiting out the correction.

    2. What do you think is going on?

    It doesn’t matter how strong the wind is blowing and it doesn’t matter how much the pennant is flapping… What do YOU think is going on?

    • If you think it’s the end of the world, you’re going to panic and sell.
    • If you think, this time is different than the last correction and that it won’t go up again, you’re going to panic and sell again.
    • If you think the market will just keep ‘crashing’ down, or it will take a hundred years for it to recover, you’re going to panic and sell!
    • If you think that something so major happened in the economy that the market cycle has been repealed and the companies will stop making profits from now on, you’re going to panic and sell.


    All this has nothing to do with the wind and it has nothing to do with the pennant…this is just ‘your mind moving’.

    I think you might begin to understand by now, that rather than studying corrections, we should focus on how people process the idea of a correction (and from my perspective of a financial coach, how passionately they’re coached).

    Simply because this is what’s going to make all the difference. These are all the behavioural variables and therefore are all variables under our control.

    But you need to recognise it and your financial (investment) adviser needs to recognise it.

    Otherwise, all will be lost.


    Still have questions or concerns?

    It can really help to seek the help of a professional to discuss the best investment strategies for you. Why not call us to arrange an appointment on 02 9328 0876.


    Article by Michal Bodi | Senior Financial Planner

    Photo by Brooke Lark on Unsplash


    General Disclaimer: This article contains information that is general in nature. It does not take into account the objectives, financial situation or needs of any particular person. You need to consider your financial situation and needs before making any decisions based on this information. Please seek personal financial advice prior to acting on this information.

    Bear Market Territory

    Shares hitting bear market territory

    Bear Market Territory

  • Global growth worries could drive more short term weakness. But in the absence of a US/global recession it’s hard to see a deep and long bear market.
  • The key for investors is to recognise that periodic declines in share markets are normal, that selling after big declines just locks in a loss, that dividend income from a well-diversified portfolio is little affected by share market volatility and that income flow from Australian shares is now very high relative to bank deposits.
  • Introduction

    The malaise affecting equity markets and risk assets generally has shown no let up with Australian shares slipping into bear market territory yesterday (defined as a 20% or greater decline from the most recent high). In some ways it is reminiscent of 2008 with tightening credit markets, bank shares under pressure and worries central banks are powerless. 

    From their highs last year to their latest lows US shares have now had a fall of 13%, Australian shares -20%, Japanese shares -25%, European shares -26%, Emerging market shares -27% and Chinese shares -49%. So Australia is not alone – in fact the drivers of the fall from last year’s high are global and many markets have had deeper falls. With global growth worries likely to linger we could still see more downside in the short term. However, a critical differentiator between whether that further downside is say 5-10% and short versus say another 25% and drawn out is likely to be whether the US/global economy has a recession and whether central banks can provide more helpful policy support.

    Fault lines in the global economy

    What started in January as mainly China based worries has clearly broadened back out to concerns about global growth. At its core there are five fault lines running through the global economy. The first is the malaise in emerging markets that began earlier this decade, with Brazil and Russia in recession. The second is the ongoing concern about China and its intentions regarding the value of the Renminbi. The third is the collapse in commodity/oil prices which is weighing on energy producers and hence business investment, credit markets and driving selling by sovereign wealth funds. The fourth is the strong $US which has made the fall in the oil price worse, raised debt servicing concerns in the emerging world and weighed on the US economy. Finally, there is fear itself as financial market turmoil drives fears that this will cause a global recession (via reduced confidence, lower wealth and tighter credit conditions) which in turn is reinforcing selling pressure and pushing share markets even lower. Worries about banks – and their exposure to energy loans & higher bad debts if there is a recession – seem to be at the centre of this.

    These are all feeding on each other to a degree. However, there are some positives: Chinese economic data has been more mixed rather than negative lately; the Renminbi has settled and the $US looks to have peaked; and central banks are becoming more dovish. But I think there are three key issues. How serious is the problem regarding banks? Will the US have a recession? And are central banks out of ammo?

    What is the risk of another bank crisis/credit crunch?

    While the risks have risen, there are several reasons for believing that a GFC style credit crisis is unlikely. Banks are better capitalised now, US and European bank exposure to energy loans at around 2-4% of total assets is a fraction of their exposure to housing loans (at the centre of the GFC), new restrictions on proprietary trading have limited banks’ exposure to riskier corporate debt and the issues of low transparency and complexity that bedevilled the sub-prime mortgage market are not really an issue in corporate debt markets now. So far we are not seeing any blow out in interbank lending rates.

    Is the US economy headed for recession?

    This is a critical question as the US share market sets the direction for global shares including the Australian share market and the historical experience tells us that slumps in shares tend to be shallower and/or shorter when there is no US recession and deeper and longer when there is (eg the tech wreck and GFC). See the adjacent table.

    Falls in US shares greater than 10% since 1989

    blog content 04032016 falls us shares 

    Bear markets highlighted in black. Source: Bloomberg, AMP Capital

    A range of considerations have raised the risk of a US recession: December quarter GDP growth slowed sharply; credit spreads (ie, the interest rates on corporate bonds relative to government bonds) have blown out to levels associated with recessions; and falling energy related investment is weighing on manufacturing. But against this:

    • US growth has regularly run hot and cold since the GFC.
    • We have seen none of the excesses that precede recessions – like excessive growth in private debt, over investment in housing or capital goods, high inflation or a speculative bubble in shares or housing.

    No US investment boom

    04032016 us invest

    Source: Thompson Reuters, AMP Capital

    04032016 us oil

    Source: Thomson Reuters, AMP Capital

    • Some of the softness in recent US economic data has been due to falling energy related investment. But with resource investment having fallen from 0.9% of US GDP to just 0.4% the bulk of the damage from this may already be behind us.

    US oil investment has already collapsed

    • While the collapse in oil prices is a big drag on energy producers, it is a huge boost to household spending power. This is very different to the loss of household wealth that flowed from the housing collapse at the centre of the GFC. 
    • Nor have we moved to an inverted yield curve (where short term interest rates exceed long term interest rates) driven by aggressive monetary tightening like the 17 Fed interest rate hikes seen prior to the GFC. Inverted yield curves have regularly warned of recession.

    The US yield curve is far from inverted

    blog content 04032016 us yeild

    Source: Bloomberg, AMP Capital

    We would put the risk of a US/global recession at around 25%.

    Are central banks out of ammo?

    This is a common concern with interest rates already at or around zero for major central banks. However, they are a long way from being unable to do anything: the Fed can reverse last year’s interest rate hike and launch another round of quantitative easing; the ECB could provide more cheap short term funding for banks; both the ECB and Bank of Japan could expand their quantitative easing programs; and quantitative easing programs could be focussed on buying corporate debt to bring down corporate borrowing rates. More negative interest rates are also an option but central banks may be wary of this after the negative impact of Japan’s move on banks. Perhaps the ultimate option is for central banks to provide direct financing of government spending or tax cuts.

    If credit markets and bank share prices don’t settle down soon many or all of these measures are likely to be adopted with the ECB potentially launching a QE program focussed on buying corporate debt as early as next month.

    Meanwhile, the People’s Bank of China (with an official benchmark rate of 4.35%) and the RBA (with an official cash rate of 2%) still have a long way to go before they even have to consider unconventional monetary policies.

    What should investors do?

    Times like the present are very stressful as no one likes to see the value of their investments decline. Investors need to allow for several things though: 

    • First, sharp falls are regular occurrences in share markets – we have seen it all before. Shares literally climb a wall of worry over many years with numerous events dragging them down periodically, but with the trend ultimately rising and providing higher returns than other more stable assets.
    • Second, selling after a major fall just locks in a loss.
    • Third, when shares and growth assets fall they are cheaper and offer higher long term return prospects. So the key is to look for opportunities that the pullback provides – shares are getting cheaper, investment yields on shares and corporate debt are rising. It’s impossible to time the bottom but one way to do it is to average in over time.
    • Fourth, while shares may have fallen in value the dividends from the market haven’t. So the income flow you are receiving from a well-diversified portfolio of shares continues to remain attractive, particularly against bank deposits.

    Australian shares offering a very high yield versus bank deposits

    • Fifth, shares and other related assets will bottom at the point of maximum bearishness, ie just when you and everyone else feel most negative towards them. So the trick is to buck the crowd. As Warren Buffett once said: “I will tell you how to become rich…Be fearful when others are greedy. Be greedy when others are fearful”.
    • Finally, turn down the noise. At times like the present the flow of negative news – via traditional and social media – reaches fever pitch, making it harder to stick to an appropriate long term strategy let alone see the opportunities that are thrown up.
    04032016 au shares

    Source: RBA, Bloomberg, AMP Capital


    Still have some questions?

    If you want to discuss your investment strategy with one of our advisors. Call us to arrange an appointment on 02 9328 0876.


    Article by AMP Capital


    General Disclaimer: This article contains information that is general in nature. It does not take into account the objectives, financial situation or needs of any particular person. You need to consider your financial situation and needs before making any decisions based on this information. Please seek personal financial advice prior to acting on this information.

    Important note: While every care has been taken in the preparation of this article, Sydney Financial Planning makes no representations or warranties as to the accuracy or completeness of any statement in it including, without limitation, any forecasts. Past performance is not a reliable indicator of future performance. This article has been prepared for the purpose of providing general information, without taking account of any particular investor’s objectives, financial situation or needs. An investor should, before making any investment decisions, consider the appropriateness of the information in this article, and seek professional advice, having regard to the investor’s objectives, financial situation and needs. This article is solely for the use of the party to whom it is provided.

    Simple doesn't mean easy

    Simple…Doesn’t Mean Easy

    Simple doesn't mean easy


    The short answer is no. The longer answer would be:

    In times of market volatility (nervousness and high emotion) it’s often good to reflect and put things in context. In Nov 2007, the Australian share market was at its all-time high. In 2009 it fell 54%. Since then, the ASX200 returned to almost 6000,recouping almost 80% of the lost ground. Today the Australian share market currently sits around the 5000 mark. 

    Ok, so what does it all mean and what do I have to do?  The answer is not much, except remembering the conversations about investing with your financial planner.

    These ups and downs (or the volatility as the experts call it) are absolutely normal. They’re organic and we want them to happen. If we didn’t want this volatility in the first place, we’d simply always keep your money in cash. But that wouldn’t be that great either as after inflation there would be nothing left. Therefore, the volatility is good!  It’s there for the same reason as the premium returns we get from investing in great businesses in Australia and overseas (also called shares). We have to accept it and appreciate it.

    For those people in accumulation phase, still working and contributing into super/investments (let’s call this group – the buyers) this presents a great value opportunity to accumulate more at attractive prices. Just picture going to a fruit market, having same amount of money in your pocket as yesterday and seeing lower prices. As a buyer, you’re getting more value for your money. Happy days.

    For those people who finished investing new money – in retirement phase (let’s call this group – the receivers) – we need to remember that the income they receive from their portfolio is not paid based on its value (or what the portfolio is worth) but the number of units they hold. And although the volatility impacts on the first, it doesn’t have any impact on the latter.

    It also highlights the importance of maintaining cash (one or two years’ worth) in your retirement income portfolios to help weather the volatility and not forcing you to sell.

    Finally, the share market, just like us, is emotional. There are no good or bad markets. There’s just the market. And Mr Market has a bad temper sometimes. The best we can do is to leave him alone and not try to control it. Or as your financial coach will always tell you, let’s take a step back and think about why we’re investing in the first place. This is the main reason you hired them – to put things in perspective and to stop you from making bad decisions with your money.


    Still have some questions?

    If you want to discuss your investment strategy with one of our advisors. Call us to arrange an appointment on 02 9328 0876.


    Article by Michal Bodi | Senior Financial Planner


    General Disclaimer: This article contains information that is general in nature. It does not take into account the objectives, financial situation or needs of any particular person. You need to consider your financial situation and needs before making any decisions based on this information. Please seek personal financial advice prior to acting on this information.

    Can your portfolio weather the oil shock?

    Shares down on the oil shock – 5 key charts for investors to keep in mind

    Can your portfolio weather the oil shock?

  • Predicting how this will all unfold is hard. The key is to stay focussed on the basic principles of successful investing.
  • These five charts focus on principles of investing critical in times like now: the power of compound interest; don’t get blown off by the cycle; the roller coaster of investor emotion; the wall of worry; and market timing is hard.
  • Introduction

    Most of the time share markets are relatively calm, but periodically they tumble and generate headlines like “billions wiped off share market.” Sometimes it ends quickly and the market heads back up again. But every so often share markets keep falling for a while. Sometimes the falls are foreseeable (usually after a run of strong gains), but rarely are they forecastable (which requires a call as to timing and magnitude). And now with the US and Israel waging War on Iran its happening again with falls gathering pace as the War drags on. From their record highs earlier this year 7%, Japanese shares have fallen 13%, Eurozone shares are down 11% and Australian shares are down 9%.

    While the details regarding the current plunge differ from past falls, from the point of view of basic investment principles, it’s hard to say anything new. Which is why this note may sound familiar with “5 key charts for investors to keep in mind”.

    The current state of the War and flow on to markets

    We are now into the fourth week of the War with no clear sign of an end – despite President Trump’s frequent reassurances that the end is near.

    • A problem is Trump indicated regime change was a goal – along with a group of military objectives – and killing of Iran’s leaders and musing about replicating the Venezuelan model appear to confirm this.
    • So, Iran took the long-predicted response of attacking regional oil and gas infrastructure and effectively closing the Strait of Hormuz.
    • Which in turn has potentially created the biggest oil & energy shock in history given 20% of world oil and gas flows through the Strait.
    • This in turn has led to a surge in oil and gas prices which in turn has seen bond yields rise on inflation fears, the expected profile for official central bank interest rates rise sharply and shares fall on fears of higher inflation and rates and weaker growth and profits.
    • By declaring that the War would be over “very soon” on 9 March and that he was considering “winding down” the War on 20 March, both after sharp oil price rises, Trump has signalled he can’t bear the full economic and political costs of the War. So just like his TACO back down on tariffs last year, many assume he will do the same this time which is why the rise in oil prices and fall in shares has so far been relatively mild.  For example, global oil prices are up “just” 90% from their January low (compared to three or four fold increases in the 1970s oil shocks which were arguably smaller) and US shares have only fallen 7% and Australian shares 9% which are both much smaller than last year’s tariff related slump and the falls around the 2022 inflation and interest rate scare.
    • But the Iranian leadership shows no sign of waving a white flag and in fighting for survival wants to inflict maximum economic and political pain on Trump – which they know they can do by restricting oil supplies. So this makes it harder to him to do a TACO.
    • There are various workarounds to the Strait blockage – Saudia Arabia’s pipeline to the Red Sea, stockpile releases, US naval escorts, Iran letting non-enemy ships through, etc – but its unclear they are enough or will work. Eg the US doesn’t have the capacity to defend every tanker. If Iran lets too many ships pass it weakens its leverage. And the US may not like the idea of Iran deciding who goes through.
    • Right now, despite lots of confusing comments from Trump the risk is more escalation – with a consideration of using troops and now threatening to obliterate Iran’s power plants. Iran is threatening more retaliation against energy infrastructure in response.
    • Past oil price shocks unfolded over months as the impact became clearer – four months in 1973-74 when oil prices rose four-fold and over more than a year in 1979-80 when oil prices rose three-fold. So, it’s still early days.
    • So, the threat of stagflation remains and it’s at a time of various other threats to shares around AI, private credit & stretched valuations.
    • Current average capital city petrol prices in Australia of around $2.45 will if sustained add 1.5% to inflation taking it above 5% and add $114 a month to the household petrol bill which along with increasing risks of fuel shortages will lead to a big hit to economic activity.

    Our base case is that the War and oil shock will be relatively short as Iran will not be able to keep the Strait closed indefinitely and Trump will look for an off ramp as political pressure builds ahead of the midterms. But it could still go on for weeks yet and so could still see oil prices rise more in the interim say to $US150. We continue to see the risk of a 15% or so correction in shares this year but the size of the threat means there is a high risk it may be deeper. Trying to work out how all this plays out is not easy. But looking at shares around major geopolitical events, the typical playout is for a sharp fall of around 8% but then a recovery over the next 12 months of around 14%. Of course, there are wide ranges around this. Given the uncertainty now is a critical time to stick to basic principles of investing. So, this note revisits five key charts investors should keep in mind.

    Chart #1 The power of compound interest

    This chart shows the value of $1 invested in various Australian assets in 1900 allowing for the reinvestment of dividends & interest along the way.

    Chart 1 shares vs bonds cash over long term australia

    Includes dividends. Source: ABN-Amro Global Investment Returns Yearbook, Bloomberg, AMP

    That $1 would have grown to $278 if invested in cash, to $998 if invested in bonds and to $1,000,977 if invested in shares up till now. While the average return since 1900 is only double that on shares versus bond, the huge difference between shares and bonds owes to the impact of compounding – or earning returns on top of returns over time. So, any return earned in one period is added to the original investment so that it all earns a return in the next period. And so on. Which means higher average returns over time compound into much higher end point values. Key message: to grow wealth, we must have exposure to growth assets like shares and property that provide higher long term average returns.


    Chart #2 – Don’t get blown off by cyclical fluctuations in shares

    The trouble is that shares can have lots of setbacks, eg, see the arrows on the previous chart. Even annual returns are highly volatile, but longer-term returns tend to be solid and relatively smooth. Since 1900, for Australian shares roughly two years out of ten have had negative returns but there are no negative returns over rolling 20-year periods.

    Chart 2 - Australian share returns over rolling 12 month and 20 year periods

    Source: Bloomberg, AMP

    Understanding that these periodic setbacks are just an inevitable part of investing is important in being able to stay the course. Key message: big short-term swings in shares are normal but the longer the horizon, the greater the chance your investments meet their goals.

    Chart #3 Beware the roller coaster of investor emotion

    Investment markets move more than can be justified by moves in their fundamentals, because investor emotion plays a huge part. The next chart shows the roller coaster that investor emotion traces through the course of an investment cycle. Once a cyclical bull market turns into a bear market, euphoria gives way to ultimately depression at which point the asset class is under loved and undervalued and everyone who is going to sell has – and it becomes vulnerable to good (or less bad) news. This is the point of maximum opportunity for investors to buy into an asset at depressed prices. Once the cycle turns up again, depression gives way to hope and eventually euphoria. This is the point of maximum risk.

    Chart 3 the roller coaster of investor emotion

    Source: Russell Investments, AMP

    Key message: investor emotion plays a huge role in driving swings in markets. The key for investors is not to get sucked into this emotional roller coaster. Of course, this is easier said than done, so many investors end up getting wrong footed – by buying at the top when everyone is bullish and selling at the bottom when everyone is bearish (like in April last year on US tariffs, or maybe soon on worries about the oil supplies).

    Chart #4 The wall of worry

    There is always something for investors to worry about. And this has certainly been the case since Trump returned with his contradictory and confusing utterances. But the global economy has had plenty of worries, but it got over them with Australian shares returning 11.6% per annum since 1900, in a broad rising trend, and US shares returning 10% pa.

    Key message: worries are normal around the economy and investments and sometimes they become intense – like now. But they eventually pass.

    Chart 4 Australian shares climb a wall of worry

    This shows the All Ords price index while the first chart included dividends. Source: ASX, AMP

    Chart #5 Timing markets is hard

    With the benefit of hindsight many swings in markets around things like the GFC and the 2022 inflation surge look inevitable and so it’s natural to think about switching between say cash and shares within your super fund to anticipate market moves. But trying to time the market is difficult. A good way to demonstrate this is with a comparison of returns if an investor is fully invested in shares versus missing out on the best (or worst) days. The next chart shows that if you were fully invested in Australian shares from January 1995, you would have returned 9.4% pa.

    sfp insight ed07 2026 05 missing the best and worst days

    Jan 1995 to Feb 2026 & includes dividends but not taxes & fees. Source: Bloomberg, AMP

    If by trying to time the market you avoided the 10 worst days (yellow bars), you would have boosted your return to 12% pa. And if you avoided the 40 worst days, it would have been 16.5% pa! But many investors only get out after bad days & miss some of the best days. If by trying to time things you miss the 40 best days (blue bars), the return falls to 3.7% pa.

    Key message: trying to time the share market is not easy. For most – whether as a super fund member or an investor outside super – it’s best to stick to an appropriate well thought out long term investment strategy.


    Dr Shane Oliver
    Head of Investment Strategy and Chief Economist


    Worried about how oil shocks affect your investments?

    Speak with our Financial Planners about protecting your portfolio during market volatility and staying focused on long-term goals. To book a meeting get in contact with us on 02 9328 0876.


    This article was prepared by Dr Shane Oliver with opening and closing summary by William Bracey – CEO & Senior Financial Planner from Sydney Financial Planning. Dr Shane Oliver who provides economic forecasts and analysis of key variables and issues affecting, or likely to affect, all asset markets. He also provides economic forecasts and analysis of key variables and issues affecting, or likely to affect, all asset markets.

    Sydney Financial Planning Pty Ltd (ABN 29 606 413 254), trading as Sydney Financial Planning & Illawarra Financial Planning is an Authorised Representative & Credit Representative of Charter Financial Planning Limited, Australian Financial Services Licensee and Australian Credit Licensee.

    This article contains information that is general in nature. It does not take into account the objectives, financial situation or needs of any particular person. You need to consider your financial situation and needs before making any decisions based on this information. If you decide to purchase or vary a financial product, your financial adviser, and other companies within the AMP Group may receive fees and other benefits. The fees will be a dollar amount and/or a percentage of either the premium you pay or the value of your investments. Please contact us if you want more information. If you no longer wish to receive direct marketing from us you may opt out by contacting Sydney Financial Planning . You may still receive direct marketing from AMP as a product issuer, bringing to your attention products, offerings or other information that may be relevant to you. If you no longer wish to receive this information you may opt out by contacting AMP on 1300 157 173.

    Are we entering a market downturn?

    The outlook for Australian shares

    Are we entering a market downturn?

  • We see more upside in Australian shares supported by the return of profit growth. And its underperformance over the last 16 years is getting long in the tooth..
  • But rich valuations, a more hawkish RBA and global risks suggest it will be a bumpy ride.
  • What happens after the Iran/Middle East attacks?
  • Introduction

    Australian shares have had a strong start to 2026 with the ASX 200 up 3.3% and flirting with a new record high. The local market has also outperformed US shares which are down 0.1% and global shares which are up 1.6%. However, this could just be noise and follows a significant underperformance against US and global shares since 2009. So, can the gains continue and is the 16 year structural underperformance finally over?

    Source: Bloomberg, AMP

    Australian shares in a long-term context

    To get a handle on the future, it’s first useful to understand the past and here some key points on the performance of Australian shares:

    • Over the very long-term Australian shares have been a strong performer. Since 1900 Australian shares have returned 11.6% per annum once dividends are allowed for versus 10.1% pa for US shares.
    • However, Australian shares go through periods of relative out & underperformance or “mean reversion”. This can be seen in the next chart. Australian shares outperformed in the 1940s (indicated by a +), unperformed in the 1950s (indicated by a ), outperformed in the 1960s resources boom years, underperformed in the high inflation 1970s and 80s, outperformed in the 1990s (although Australia underperformed in the second half of the 1990s when the tech boom raged), outperformed dramatically in the resources boom of the 2000s and underperformed in the 2010s and this decade so far.

    sfp insight ed06 2026 australian vs global shares return mean

    Includes dividends. Source: ABN-Amro Global Investment Returns Yearbook, Bloomberg, AMP

    • The more recent swings in relative performance can be seen more starkly in the next chart. It compares the relative performance of Australian to global shares since 1970 in terms of: relative share prices in local currency terms (green line); relative total returns ie with dividends added in (blue line); and relative total returns with global shares in Australian dollars (red line). A rising ratio means Australian outperformance and vice versa.

    •  As Australian shares pay high dividend yields (3.3% currently) versus global shares (1.5%), dividends should be included in comparisons of Australian & global share returns. So, the focus should be on the blue line (comparing total returns) or the red line which compares total returns in $As, and not the green line which only looks at share prices.
    sfp insight ed06 2026 aus shares relative to global dividends currency movement

    Source: Bloomberg, AMP


    Several things stand out.

    • First, as noted earlier, over long periods of time and when dividends are allowed for Australian shares have performed well versus global shares. Since 1970 Australian shares have returned (capital growth plus dividends) 10.2% per annum versus 8.9% pa for global shares in local currency terms. However, the falling $A over this period has enhanced the return from global shares to 10.4% pa but its not that different to the return from Australian shares.
    • Second, the swings in the relative performance of Australian shares are apparent if dividends and currency moves are allowed for or not.
    • Finally, since October 2009, Australian shares have seen a long run of underperformance. Over that period, they have returned 8.5% pa compared to 11.8% pa from global shares in local currencies or 12.9% pa from global shares in Australian dollar terms (as the $A fell).

    Why has Australia underperformed since 2009?

    The underperformance of Australian shares since 2009 reflects a combination of: payback for the huge mining boom related outperformance of the 2000s; the slump in commodity prices from 2011; the lagged impact of the surge in the $A above parity against the $US into 2011; relatively tighter monetary policy in Australia for much of the post GFC period; fears that higher post pandemic interest rates will hit Australia harder due to more indebted households and Australia’s expensive property market; worries about the slowing Chinese economy; and a low exposure to tech stocks – with tech stocks propelling US shares in the pandemic and more recently with AI excitement.

    Five reasons Australia’s underperformance may be at or close to over

    There have been several occasions over the last few years where it looked like the relative underperformance of Australian shares may be ending  – such as around 2018-19 and 2022 – only to see it resume taking the ratios in the previous chart to new lows for this cycle. But there are now several positives for the Australian share market suggesting at least more upside on a 12 month view and possibly some relative outperformance.

    1. Mean reversion – the historical experience tells us that after a lengthy period of underperformance the local share market eventually bottoms and outperforms for a few years. This may now be due after more than 16 years of underperformance.
    2. Rotation from tech to non-tech shares – global investors appear to be rotating away from tech shares on the back of concerns about stretched valuations, excessive capex related to AI and worries that AI will decimate software businesses (ie “tech eating itself”). This will work against the tech heavy US share market (and was evident in the global relative underperformance of US shares last year) and may benefit the Australian share market. As we saw in the tech wreck of 2000-03 Australia’s low tech exposure turned out to positive for Australian shares and helped kick of a long period of outperformance.
    3. A new super cycle in commodities – the commodity price slump from their 2008-2011 highs looks to be over with commodities embarking on a new super cycle bull market driven by constrained supply after low levels of investment and electrification and rising defence spending driving increased demand for metals. This will benefit Australia’s resource stocks. Iron ore is likely to feature less this time around partly reflecting slowing urbanisation in China and its property slump. But it’s worth noting that copper is now a bigger contributor to BHP’s earnings than iron ore.
    4. Artificial Intelligence could add to demand for commodities – North American research provider the Bank Credit Analyst has posited that if AI driven robotics effectively boosts the supply of labour and drives a surge in global GDP, then the value of other factors of production like land and natural resources will soar. So, Australia might turn out to be a big long-term beneficiary of the AI revolution.
    5. Company profits are rising again in Australia – this is the key driver in the near term. After three years of falls listed company profits are turning up with the latest profits reporting season confirming this:  upside surprises have been surpassing downside surprises by almost two to one which is the strongest since 2021 and more companies are reporting profits and dividends up on a year ago compared to what was occurring in 2023 and 2024.

    What happens now, after the Iran/Middle East attacks? 

    The risks

    Oil and gas prices rise, leading to higher inflation worldwide, followed by higher interest rates globally. This generally results in slower economic growth around the world. Hopefully, this is a short, sharp event, and Iran is free and able to rebuild its economy and develop friendly relationships with its trading partners. In that case, oil prices would fall, inflation would ease, and economies would grow. 

    However, if the conflict were to escalate into a prolonged war, it would place significant strain on the global economy. 

    The upside

    The upside is that tensions in the Middle East ease, stability returns, oil prices fall, interest rates come down, and global economic growth strengthens. 

    ASX 200 companies reporting

    Source: Bloomberg, AMP

    Consensus earnings expectations for this year have risen to 13%.

    Australian share market eps growth

    Source: UBS, Bloomberg, AMP

    But it’s unlikely to be smooth sailing

    There are three key threats or constraints for Australian shares:

    1. Valuations are rich with the forward PE of 20 times well above its norm of 15 times and the absence of a risk premium over bonds.
    2. The RBA’s hawkish bias with the high risk of more rate hikes could threaten the Australian economic and profit growth outlook.
    Price to 12 month ahead expected earnings ratio - Australia

    Source: Bloomberg, AMP

    1. Global uncertainty around tech shares, US policies and geopolitics. As we have seen in the past, big ructions in US tech shares can have a flow on to Australian shares even if we have a low exposure to tech stocks. While the US Supreme Court has provided confidence that legal constraints remain on President Trump and Trump is now more politically constrained with the midterms this year, his replacement tariff strategy has ramped up the uncertainty around US trade policy. Finally, the high probability of another US strike on Iran risks a spike in oil prices should Iran decide to be uncooperative.


    In closing

    Being an avid share investor for over 50 years and a financial planner for almost 40 years, I’ve learnt that trying to predict investment returns short-term is a guess at best. But what I know with great certainty is what investment returns will be over the medium to long term, as long as you are well-diversified and your portfolio is well managed and aligned with your goals. The outlook for Australian shares remains positive. As good companies keep increasing their profits, the share market goes up. When the market underperforms, it represents better value. I never like paying full price! We will see what happens with AI stocks getting way overvalued; they have come back to earth at some point. Uncertainty always affects valuations. COVID was a good example; the ASX is now 71% higher than in March 2020, and that doesn’t include dividends.

    It will be a bumpy ride forward, but if you build this into a broader portfolio of assets advised by Sydney Financial Planning, the benefits are clear. It’s easy for me to look back as I’ve been doing this for a long time – helping clients build wealth and live a better life, so I have greater wisdom and a grey hair to match.


    Bill Bracey
    CEO & Founder of Sydney Financial Planning


    Want to maximise your Australian share opportunities?

    Speak with our Financial Planners about optimising your Australian equity exposure for 2026 and beyond. To book a meeting get in contact with us on 02 9328 0876.


    This article was prepared by Dr Shane Oliver with opening and closing summary by William Bracey – CEO & Senior Financial Planner from Sydney Financial Planning. Dr Shane Oliver who provides economic forecasts and analysis of key variables and issues affecting, or likely to affect, all asset markets. He also provides economic forecasts and analysis of key variables and issues affecting, or likely to affect, all asset markets.

    Sydney Financial Planning Pty Ltd (ABN 29 606 413 254), trading as Sydney Financial Planning & Illawarra Financial Planning is an Authorised Representative & Credit Representative of Charter Financial Planning Limited, Australian Financial Services Licensee and Australian Credit Licensee.

    This article contains information that is general in nature. It does not take into account the objectives, financial situation or needs of any particular person. You need to consider your financial situation and needs before making any decisions based on this information. If you decide to purchase or vary a financial product, your financial adviser, and other companies within the AMP Group may receive fees and other benefits. The fees will be a dollar amount and/or a percentage of either the premium you pay or the value of your investments. Please contact us if you want more information. If you no longer wish to receive direct marketing from us you may opt out by contacting Sydney Financial Planning . You may still receive direct marketing from AMP as a product issuer, bringing to your attention products, offerings or other information that may be relevant to you. If you no longer wish to receive this information you may opt out by contacting AMP on 1300 157 173.

    Three key cycles every investor should understand right now

    Investment cycles – what are they and why you need to be aware of them

    Three key cycles every investor should understand right now

  • Of particular importance are the long-term cycles which are often driven by waves of innovation and the 3–5 year business cycle. Lately we have been in the benign phase of the business cycle and may have be entering a weaker and more constrained phase of the long-term cycle.
  • Periods of poor returns invariably give way to great returns and vice versa. The key is to not get thrown by them.
  •  

    “The stock market is the story of cycles and of the human behaviour that is responsible for overreactions in both directions.”
    Seth Klarman( hedge fund manager and investor).

    “History doesn’t repeat but it rhymes.”
    Often attributed to Mark Twain.

    Introduction

    Whether it be the cycle of day and night, seasons, tides, the weather, fertility cycles, birth and death, etc, cycles are integral to life. And so too for economies and investment markets. Some are regular, some just rhyme. Despite attempts to end or subdue them via economic policy and regulation they live on. Usually when we declare investment cycles dead, they come back to bite us. Sometimes they bring much joy to investors, but they can also bring much angst. But what are they? What causes them? And why do investors need to be aware of them? This is particularly relevant after several years of great investment returns.

    Cycles in cycles

    Cycles in investment markets invariably refer to swings between good and bad returns. They usually take their lead from fundamental economic & financial developments but are magnified by waves of investor optimism and pessimism. There are three cycles of particular relevance.

    Long term or secular cycles – share markets go through long term or secular bull and bear phases, often lasting between 10 to 20 years. This is most clearly evident in the US share market and illustrated by the next chart.

    Source: Bloomberg, R.Shiller, AMP

    It shows the cumulative real value of $100 invested in 1900. Secular bull markets – or 10-20 year periods where the trend in shares is up – can be seen in the 1920s, 1950s and 60s, the 1980s and 90s and over the past decade. In between in the 1930s and 1940s, 1970s and 2000s are secular bear markets – which are long periods where shares have poor and volatile returns.

    Secular bull and bear phases are often related to what is known as Kondratiev waves, which take their lead from waves of technological innovation. Starting in the 1780s, water power, textiles and iron drove the first industrial revolution; steam, rail and steel drove the second industrial revolution; electricity, chemicals and the internal combustion engine drove a third Kondratiev wave into the 1920s; petro chemicals, electronics and aviation drove a fourth in the 1950s and 1960s; the IT revolution helped drive a fifth wave in the 1990s and another spurt more recently with digital media and artificial intelligence. These were associated with secular bull markets in the 1920s, the 1950s & 60s, the 1980s & 90s and over the last decade, with the move to lower interest rates and associated speculation also playing big roles in the last two.

    At the end of each long-term upswing, share markets reached overvalued extremes and investors had become excessively exposed as optimism that good times would roll on forever reached extremes. This left shares vulnerable as excesses such as too much debt (1930s and 2000s), excessive inflation (1970s) and excessive speculation in tech shares and then housing in the late 1990s and 2000s became overwhelming, giving way to economic weakness and secular bear markets.

    The business cycle – this is the best-known economic cycle and has a duration of 3 to 5 years. It tends to relate to the standard economic cycle where after a few years of economic expansion, inflation or other imbalances build up which results in monetary tightening, which leads to a downturn or recession, then falling inflation and monetary easing, which then sets the scene for the next expansion. It tends to underpin a 3 to 5 year cycle in investment markets with the stylised link to share markets, property and government bonds shown in the next chart. Shares tend to lead the business cycle – bottoming several months before an economic trough and vice versa at the top. Property markets tend to be more coincident.

    The standard 3 to 5 year investment cycle

    Standard 3-5 year investment cycle

    Source: AMP

    In terms of actual share market fluctuations, the 3-5 year investment cycle is evident in the swings in rolling 12-month changes in Australian share prices. Periods of poor returns are invariably followed by periods of strong returns (and vice versa) but trying to time this can be very hard. See the next chart.

    Australian share returns rolling 12 month & 20 year periods

    Source: ASX, Bloomberg, AMP

    Short term sentiment cycles – within the 3 to 5 year investment cycle there are also short-term swings (weekly, monthly) between overbought and oversold for things like shares and currencies driven by swings in investor sentiment, but which can relate to the tendency for economic data to run through hot and cold periods, particularly relative to market expectations. They can often give rise to corrections in share markets, with say 5 to 20% falls.

    Some observations

    There are several points to note regarding investment cycles:

    • No two cycles are the same and their duration can vary so they don’t operate to precise years, despite claims by some to the contrary. But they do have common features, usually being set off by economic or financial developments and accentuated by swings in investor sentiment which can push them to extremes from which a reversal can occur. As such, while history doesn’t repeat, it rhymes.
    • There are cycles within cycles. For example, even though US shares were in long-term secular bear markets in the 1970s and 2000s they still saw periodic cyclical swings in economies and share markets.
    • When several cycles combine the impact can be huge. For example, a business cycle downturn in 000 coincided with an end to the secular boom of the 1980s and 1990s and saw 50% falls in global shares in the period 2000 to 2003.
    • Despite various attempts to smooth them out (via economic policies and regulation) or declare them dead, cycles live on.
    • Cycles can be self-limiting as economic downturns lead to lower inventories, pent up demand and lower interest rates, which sow the seeds of recoveries. Share slumps result in cheap shares which entice bargain hunters and sow the seeds of a new bull market.
    • Investment cycles provide opportunities for investors to vary their asset allocation through the cycle, e.g. buying more shares into downturns and cutting exposure into upswings.
    • But timing investment cycles is difficult. No one rings the bell at the top or bottom. And given the psychological tendency of individual investors to project recent market moves into the future (referred to as “recency bias”) and find safety in what the crowd of other investors are doing, the main risk is that investors, in seeking to time investment cycles, end up wrong footed by selling after big falls and buying after big gains. So, for most investors it’s important to be aware of cycles and understand that they are normal, but then to take a long-term approach to investing that looks through them and makes the most of the compounding of returns over long periods.

    Where are we now?

    We are currently in a reasonably positive phase of the 3-5 year investment cycle as inflation has cooled from its 2022 high which has enabled central banks, including the Fed and RBA, to cut rates and provide a boost to economic growth. Sometimes this is referred to as “goldilocks” i.e. not too hot and not too cold. This has been reflected in strong gains in share markets over the last three years. However, President Trump’s tariffs have complicated the normal cyclical pattern by boosting US inflation and depressing employment and imparting downside risks for the US economy. And shares have had three years now of strong returns resulting in stretched valuations particularly with signs that key large cap US stocks, often referred to as the Magnificent Seven (Apple, Microsoft, Alphabet, Meta, Amazon, Nvidia and Tesla), may be becoming a bit bubbly. All of which are warning of a pullback in shares which would not be out of line with their normal volatility as evident in the previous chart, before receiving a further boost from lower interest rates.

    While AI developments remain very promising, we may be entering a weaker more constrained phase of the long-term investment cycle reflecting less favourable economic policy and demographic trends which may make the world more inflation prone.

    Other cycles of relevance

    Seasonal patterns – There is a well-known seasonal pattern in shares that sees strength from November reflecting the ending of US tax loss selling, a wind down in equity raisings, new year cheer and the reinvestment of bonuses which continues after a brief pause around February into mid-year, before weakness from around May to October, particularly in August and September. Right now, we are nearing a seasonally strong period, although it’s a bit complicated by not having seen the normal seasonal weakness in August and September in the US.

    Seasonal patterns in us and aus shares

    Source: Bloomberg, AMP

    Political cycles – these are less relevant in countries with an irregular political cycle like Australia. However, the US has a precise four-year federal political cycle, and this has given rise to a fairly regular pattern. This sees near average share market returns in the first year after a Presidential election, well below average returns in the second (or midterm election) year, but above average returns in the third year (as the President seeks to stimulate the economy), and average returns in the fourth year. In fact, since 1950 the US share market has experienced an average top to bottom fall in the mid-term election year of 17%. So next year could be a bit rougher for US shares and this could flow to Australian shares.

    In closing

    I have been following investment cycles for about 40 years now, and they can indicate future trends. But I have also learned, more importantly, that trying to time the market is nearly impossible. That’s
    why it is so important to have an investment strategy and financial plan in place and regular reviews by your financial planner.

    Please call our office on 02 9328 0876 if you need a review or if you have a friend or family member who needs financial advice.


    Bill Bracey
    CEO & Founder of Sydney Financial Planning


    Is your investment strategy prepared for market cycles?

    Speak with our Financial Planners about navigating market cycles and protecting your portfolio through economic shifts. To book a meeting get in contact with us on 02 9328 0876.


    This article was prepared by Dr Shane Oliver with opening and closing summary by William Bracey – CEO & Senior Financial Planner from Sydney Financial Planning. Dr Shane Oliver who provides economic forecasts and analysis of key variables and issues affecting, or likely to affect, all asset markets. He also provides economic forecasts and analysis of key variables and issues affecting, or likely to affect, all asset markets.

    Sydney Financial Planning Pty Ltd (ABN 29 606 413 254), trading as Sydney Financial Planning & Illawarra Financial Planning is an Authorised Representative & Credit Representative of Charter Financial Planning Limited, Australian Financial Services Licensee and Australian Credit Licensee.

    This article contains information that is general in nature. It does not take into account the objectives, financial situation or needs of any particular person. You need to consider your financial situation and needs before making any decisions based on this information. If you decide to purchase or vary a financial product, your financial adviser, and other companies within the AMP Group may receive fees and other benefits. The fees will be a dollar amount and/or a percentage of either the premium you pay or the value of your investments. Please contact us if you want more information. If you no longer wish to receive direct marketing from us you may opt out by contacting Sydney Financial Planning . You may still receive direct marketing from AMP as a product issuer, bringing to your attention products, offerings or other information that may be relevant to you. If you no longer wish to receive this information you may opt out by contacting AMP on 1300 157 173.

    What is happening with the supply of new homes in Australia?

    What is happening with the supply of new homes in Australia?

    What is happening with the supply of new homes in Australia?

  • The Labor government is arguably dedicating more time and expenditure on housing incentives to states and territories than any other government in recent history.
  • However, productivity challenges in construction – particularly in housing, overregulation and labour and material shortages – are preventing housing supply from lifting enough to meet demand.
  • Introduction

    Most economists agree that to make real progress on housing affordability, the key is to lift housing supply. The Federal government has an aim to build 1.2 million, new, well-located homes over five years.

    There has been more focus on housing in the current term of government than any before. We look at how housing supply has responded to the various policy initiatives and incentives in this SFP Insights.

    Housing demand and supply in Australia

    The demand for housing is determined quite simply by how fast the population grows, which is the combination of natural increase and net migration. Australia’s birth rate has declined to below replacement rate over recent decades (see the chart below), but it is still in line with OECD peers.

    To offset this low level of natural increase, net migration plays a larger role in bringing in working-age immigrants. Net overseas migration (permanent and long term arrivals minus departures) is accounting for a growing share of Australia’s population increase. Over the 12 months to December, 76% of our population growth (446,000 people or 1.7% over the year) was from net overseas migration, not quite a record high, but near enough!

    Global fertility rates

    Source: World Bank, AMP


    [Australian Population Growth]

    Source: ABS, AMP

    To respond to concerns about high rents and ever increasing home prices the Labor government in 2024 set a cap of 270,000 student commencements (including higher education and vocational students).

    There was a lot of anger from education providers around this cap (as international students are a big source of income for tertiary education providers and are in the top 5 exports for Australia). That’s despite the fact that the cap still keeps student commencements at all-time highs (see the chart below). In reality it was a “soft cap” because they are not legally enforceable as the Senate rejected the proposal for formal caps, so once an education provider reaches 80% of its target number, student visa applications go into a visa “slow processing lane”. In 2026, the “cap” will be lifted to 295,000.

    On net migration, the Treasury was estimating that net migration would rise by 335,000 in 24-25 and 260,000 in 25-26. These levels are likely to be breached, with current monthly arrival/departure data trending backup again towards 500,000! (see the chart below).


    Australian Foreign Student Commencements

    Source: Macrobond, Department of Education, AMP

    Australian Net Immigration Graph

    Source: ABS, Macquarie Macro Strategy, AMP

    The size of the average household is also important in demand estimates, and it is guesstimated because of the delay in receiving the numbers from the census. In Australia, the average number of people per household has declined from 2.9 persons in 1983 to a little below 2.5 persons in 2022 and going back even further from 4.8 persons per house in 1911. The number of people per household rose in the initial phase of the pandemic and then started declining in 2021 as individuals opted for more living space. The 2025 ABS Census will provide us with another update on household living space. If the size of the household has fallen by more than our assumption in recent years after the pandemic, then there may be a larger level of dwelling undersupply.

    Average Household Size Australia

    Source: ABS, RBA, AMP

    Australian Housing Supply

    Source: Macrobond, AMP

    The impact of natural increase, net migration and household size means that our estimate is that demand for housing in Australia will average at just under 180,000 for the next few years.

    Housing supply is determined by the completion of homes, after taking into account demolitions, conversions and vacant properties (which do not add to new supply). The June housing completions figures are not out yet, but should be running at over 180K, based on building approval figures.

    While this would be a lift from recent quarter, it is still below the government’s targeted levels, which are closer to 240,000. Supply has been challenged in Australia because of poor productivity growth in construction, development delays, slow land release, too much regulation and labour and material shortages. While it would be good to see supply running at close to 240,000 per year in the next few years, this will be challenging in the current environment. Our forecasts are for housing completions to average at 190,000 per year, which is a lift of around 10,000 from where we saw supply a year ago.

    In Australia, demand for housing started running noticeably above supply from 2006 until 2015. This is when the issue of housing undersupply started. Home price growth was strong over this period, although slowed significantly during the GFC.

    Supply started running above demand from 2015-2022 thanks to significant multi-density construction which helped to alleviate the housing undersupply. However, poor levels of construction in recent years and a catch up in population growth has mean that demand has (again) far outstripped supply, leading to an increase in accumulated housing undersupply. On our estimates, the shortage of dwellings is at least 200,000 (see the chart below).


    Home Construction Underlying Demand

    Source: ABS, AMP

    Australian Vacancy Rates

    Source: Macrobond, Cotality, AMP

    Other indicators of the low supply of homes are in the vacancy rates which are all in a very tight range, at under 2%, a record low for the capital cities.

    Productivity in construction

    Productivity has been a hot topic in recent months, partly because of the Treasurer’s Economic Reform Round-table but mostly because of the dismal level of productivity growth in Australia (labour productivity has averaged at 0.3% per year over the last decade)! But productivity in construction has had one of lowest levels of performance across all industries. Labour productivity in construction has grown by just 15% since 1994, compared to the average of 46% – see the chart below.

    Australian Productivity Growth

    Source: ABS, AMP

    The Productivity Commission found that productivity was particularly weak in house and apartment construction. The number of dwellings completed per hour worked for housing construction worked has declined by 53% over the past 30 years. Accounting for quality and size improvements, it is down by 12%. In contrast, total labour productivity has increased by 49% over this period. CEDA and the Productivity Commission have noted numerous factors contributing to this including: the small size of firms (due to tax incentives) leading to a problem with scale and ability to invest and regulatory burden with development, planning and construction rules (CEDA gives the example that a development application for a 3-storey block of apartments in Sydney in 1967 was 12 pages long and these days it would be hundreds if not thousand pages long due to extensive structural, environmental, traffic and heritage assessments.

    Unless productivity improves in construction, Australia will not be able to meet its goals for housing supply. Hopefully we are on the right path to alleviating some of the roadblocks following the productivity round table,
    but it will take time to work its way through the economy. Thegovernment’s decision to freeze the National Construction Code until mid-2029 (excluding essential safety and quality changes) is a good first step. Other measures in the near-term to speed up construction could be to speed up and simplify approvals could be to use AI to fast-track the multi-stage approval process.

    Government initiatives to increase housing supply

    Arguably, the Labor government has paid housing affordability more attention than any other recent government, probably because the issue of housing affordability has now reached an even more critical point with home price growth surging by 19% since the 2023 post-pandemic low. Younger age groups are trending up again as a share of the population, after a downtrend since the 1980’s (see the chart below) and is close to the share of the population aged over 55 now.

    The Federal government has the national housing policy responsibility and the coordination between the states and territories. The state governments are the ones that need to deliver housing and homelessness services. The National Housing Accord signed in 2024 is an agreement to build 1.2million homes over the 5 years from mid-2024 until mid-2029, providing multiple payments state and territory governments to meet supply goals. Additionally, there has been more funding allocated for social and affordable housing in the Budget, build-to-rent housing (housing that is specifically built for those wanting to rent although this is only a few thousand homes a year), expansion in the Help to Buy scheme, where the government takes an equity share for buyers with a small deposit as well as the recently expanded Home Guarantee scheme for First Home Buyers that allows first home buyers to buy a property with only a 5% deposit, avoiding lenders mortgage insurance.

    Although the impacts of the first home buyer scheme are mixed. In the short-term, it may add to demand in the new purchasing market but in the longer-term, it may help to lift supply as demand for dwellings increase.

    Implications for investors

    The problems with Australia’s housing supply continues to put upward pressure on home prices, making Australia’s high home prices even higher and exacerbating affordability problems. Australia’s home price-to-annual wages ratio remains around a record high at nearly 14 times (which means that a median home is worth approximately 14 years of average wages), doubling from ~5 prior to 2000 and above our global peers. In Australia, home prices continued to accelerate in recent years, despite higher interest rates. This is in contrast to neighbouring countries where home price growth has been much slower, or even contracting like Canada, Germany and New Zealand since 2022 and is now turning down in the US.

    Global Home Prices

    Source: Microbond, Bloomberg, AMP

    Home prices are likely to have another strong year of growth as supplyis unable to catch up with demand in the short-term, the RBA continuesto cut interest rates and first home buyer incentives increase demand. We expect national home price growth to be 7% in 2025 and 8-10% growthin 2026. This means that the home price-to-income ratio will continue torise, as home prices outpace incomes.

    Closing Summary

    Economics 101 – “The law of supply and demand” In Sydney housing, there is an undersupply and still an excess of demand. The cost of living and building costs are sadly making it harder for most people to buy a home. Clearly, it’s tougher now than when I bought my first home in 1988 for $300,000. Until supply catches up with demand, prices will continue to rise – especially as interest rates come down.

    But as the economy slows, fewer people will be able to afford to buy. This will be the tipping point. We’re not there yet! So, expect prices to rise again in the medium term until we reach that tipping point.


    Bill Bracey
    CEO & Founder of Sydney Financial Planning


    Is your investment strategy prepared for rising property prices?

    Speak with our Financial Planners about positioning your portfolio for housing market trends, to book a meeting get in contact with us on 02 9328 0876.


    This article was prepared by Dr Shane Oliver with opening and closing summary by William Bracey – CEO & Senior Financial Planner from Sydney Financial Planning. Dr Shane Oliver who provides economic forecasts and analysis of key variables and issues affecting, or likely to affect, all asset markets. He also provides economic forecasts and analysis of key variables and issues affecting, or likely to affect, all asset markets.

    Sydney Financial Planning Pty Ltd (ABN 29 606 413 254), trading as Sydney Financial Planning & Illawarra Financial Planning is an Authorised Representative & Credit Representative of Charter Financial Planning Limited, Australian Financial Services Licensee and Australian Credit Licensee.

    This article contains information that is general in nature. It does not take into account the objectives, financial situation or needs of any particular person. You need to consider your financial situation and needs before making any decisions based on this information. If you decide to purchase or vary a financial product, your financial adviser, and other companies within the AMP Group may receive fees and other benefits. The fees will be a dollar amount and/or a percentage of either the premium you pay or the value of your investments. Please contact us if you want more information. If you no longer wish to receive direct marketing from us you may opt out by contacting Sydney Financial Planning . You may still receive direct marketing from AMP as a product issuer, bringing to your attention products, offerings or other information that may be relevant to you. If you no longer wish to receive this information you may opt out by contacting AMP on 1300 157 173.

    Share market falls - seven key things for investors to bear in mind

    Share market falls – seven key things for investors to bear in mind

    Share market falls - seven key things for investors to bear in mind

  • It’s still too early to say markets have bottomed and we continue to see a high risk of a 15% plus correction, although calendar year returns should still be okay.
  • This will weigh on short term super fund returns but follows two years of very strong returns.
  • Key things for investors to bear in mind are that: share pullbacks are healthy and normal; in the absence of a recession a deep and long bear market should be avoided; selling shares after a fall locks in a loss and timing markets is hard; share pullbacks provide opportunities for investors to buy them more cheaply; shares still offer an attractive income flow; and to avoid getting thrown off a long-terminvestment strategy it’s best to turn down the noise.
  • Introduction

    Much of the time share markets are relatively calm and so don’t generate a lot of attention. But periodically they tumble and generate headlines like “billions wiped off share market” and “biggest share plunge since…” Sometimes it ends quickly and the market heads back up again and is forgotten about. But every so often share markets keep falling for a while. Sometimes the falls are foreseeable (usually after a run of strong gains), but rarely are they forecastable (which requires a call as to timing and magnitude) despite many claiming otherwise. In my career, I have seen many periodic share market tumbles and so they are nothing new.

    And now it’s happening again with share markets falling from record highs just a few weeks ago. From their all-time highs to their lows in February US shares have fallen 9%, global shares have fallen 8% and Australian shares have fallen nearly 9%. Always the drivers are slightly different. But as Mark Twain is said to have said “history doesn’t repeat but it rhymes”, and so it is with share market falls. This means that from the point of basic investment principles, it’s hard to say anything new. Which is why this note may sound familiar with “key things for investors to keep in mind”, but at times like this they are worth reiterating.

    What’s driving the plunge in share markets

    The key drivers of the fall in shares are a combination:

    • Stretched valuations after a relatively calm year last year with strong returns. The strong gains in share markets after the inflation driven weakness of 2022 and still relatively elevated bond yields left US shares offering no risk premium over bonds (as measured by the gap between the forward earnings yields and 10 year bond yields).Australian shares were not much better. This left shares vulnerable to bad news. The equity risk premiums have improved a bit with recent falls but still remain low.

    Source: Bloomberg, AMP

    • While investor sentiment was not seeing the euphoria often evidentat major share market tops, there was a bit of speculative froth evident in the huge gains in the Magnificent Seven stocks (Apple,Microsoft, Amazon, Alphabet, Meta, Nvidia and Tesla). These had accounted for nearly two thirds of US share market gains in 2023 and over 50% in 2024 taking them to roughly 35% of the S&P 500’s market capitalisation. Their huge gains left them vulnerable to a pullback with DeepSeek’s apparent success weighing on Nvidia and Telsashares plunging more than 50% since their January high partly owing to signs of a buyer backlash against Elon Musk. This heavy reliance on a handful of shares added to the US share markets vulnerability.
    • Another bout of sticky US inflation saw expectations for Fed rate cuts this year wound back a few weeks ago.
    • But the trigger for the pullback has really come from the frenetic and often contradictory policy announcements from the White House around tariffs, public sector cutbacks and US relations with allies. This has contributed to a run of weaker US economic data, fears ofrecession and desire by investors for a higher risk premium fromshares. Those fears intensified after Trump and members of his team seemed to not rule out a recession with Trump talking about a“period of transition” and saying that he is not worried about falls inthe share market and Treasury Secretary Bessent talking about 6-12months of pain and “a detox period” (presumably from government).
    • As always, the most speculative “assets” are getting hit the hardest and this includes tech stocks (with the Magnificent Seven down 20% and Nasdaq down 14%) and Bitcoin (which has fallen 23%).

    Share markets are oversold and so may see a short-term bounce. But our assessment is that increasing uncertainty and stretched valuations mean there is a high risk of further falls in shares. At some point economic weakness and its impact on support for Trump and Republican politicians along with share market falls – with Trump ultimately seeing share gains as a key performance indicator – will put pressure him to reverse course and focus on more positive policies. But we are likely not at that point yet. So, we continue to see a high likelihood of a 15% plus correction in shares before more positive forces around Trump’s tax cuts and deregulation and more Fed rate cuts get the upper hand.

    Key things for investors to bear in mind

    First, while they unfold differently, periodic share market corrections and occasional bear markets (which are usually defined as falls greater than 20%) are a normal part of investing in shares. 

    See the next chart.

    Periodic share market pull backs are normal

    Source: Bloomberg, AMP

    And, as can be seen in the next chart rolling 12 month returns from shares have regularly gone through negative periods.

    sfp ed2 03 2025 aus share returns over rolling 12 mth 20 yr 001

    Source: ASX, Bloomberg, AMP

     But while the falls can be painful, they are healthy as they help limit excessive risk taking. Related to this, shares climb a wall of worry over many years with numerous events dragging them down periodically (next chart), but with the long-term trend ultimately up and providing higher returns than other more stable assets. As can be seen in the previous chart, the rolling 20-year return from Australian shares has been relatively stable and solid. Which is why super funds have a relatively high exposure to shares along with other growth assets. Bouts of volatility are the price we pay for the higher longer-term returns from shares compared to more defensive assets like cash and government bonds. 

    Australian shares climb wall of worry

    Source: ASX, AMP

    Second, historically, the main driver of whether we see a correction (a fall of say 5% to 15%) or even a mild bear market with say a 20% or so decline that turns around relatively quickly like we saw in 2015-2016 in Australia – which may be called a “gummy bear market” – as opposed to a major “grizzly” bear market (like that seen in the mid-1970s or the global financial crisis when shares fell by around 55%) is whether we see a recession or not – notably in the US, as the US share market tends to lead most major global markets. 

    While Trump’s policies and the noise around them has increased the risk of a US/global recession our base case is that it will be narrowly avoided as Trump pulls back under political pressure and signs of weaker growth enable the Fed to start easing again and other global central banks including the RBA continue to cut rates. But recession is now a more significant risk so it’s too early to say share have bottomed. Of course, short-term forecasting is fraught with difficulty and should not be the basis for a long-term investment strategy, so it’s better to stick to long term investment principles.

    Third, selling shares or switching to a more conservative superannuation investment strategy whenever shares fall sharply just turns a paper loss into a real loss with no hope of recovery. Even if you get out and miss a further fall, the risk is that you won’t feel confident to get back in until long after the market has fully recovered. The best way to guard against deciding to sell on the basis of emotion after falls in markets is to adopt an appropriate long-term strategy and stick to it.

    Fourth, when shares fall, they’re cheaper and offer higher long-term return prospects. So, the key is to look for opportunities’ pullbacks provide. It’s impossible to time the bottom but one way to do it is to “average in” over time. Fortunately, the Australian superannuation system does just that by regularly putting money into shares for employees (via their super) taking advantage of the fact they are cheaper.

    Fifth, while share prices have fallen dividends have not. While the rebound in interest rates since 2022 reduced the yield advantage shares had over cash it’s likely now starting to wide again with the RBA starting to cut interest rates and likely to do more. 54% of companies raised their dividends compared to a year ago in the just completed December half earnings reporting season so the income flow from a well-diversified portfolio is likely to remain attractive.

    Australian shares grossed up dividends yield vs bank deposit rate

    Source: RBA, Bloomberg, AMP

    Sixth, shares and other related assets often bottom at the point of maximum bearishness, i.e. just when you and everyone else feel most negative towards them. So, the trick is to buck the crowd. “Be fearful when others are greedy. Be greedy when others are fearful,” as Warren Buffett has said.

    Finally, turn down the noise. At times of uncertainty like now, the flow of negative news reaches a fever pitch. This makes it harder to stick to your long-term financial plan and investment strategy. But remember, like all quality assets, they recover over time. When they get cheaper, they can represent great value. This fact is quickly forgotten by the media and the masses.

    As I’ve stated many times before, that’s how the rich get richer and the poor sell what they think are distressed assets at low prices to the rich, who can afford to buy low and hold quality assets.

    The great news is, if you’re reading this, you are in great hands as you are being advised by Sydney Financial Planning. If you start to get wobbly knees, please call us to review your strategy/plan. We have normally built this in, so you can prosper. The value of this advice and having a trusted relationship with an experienced team during times like this is what we call the Value of Advice.

    Bill Bracey
    CEO & Founder of Sydney Financial Planning


    Are you ready to take advantage of investment opportunities?

    Arrange a meeting with one of our Financial Planners to get the right investment decisions in place, either book a meeting or get in contact with us on 02 9328 0876.


    This article was prepared by Dr Shane Oliver with opening and closing summary by William Bracey – CEO & Senior Financial Planner from Sydney Financial Planning. Dr Shane Oliver who provides economic forecasts and analysis of key variables and issues affecting, or likely to affect, all asset markets. He also provides economic forecasts and analysis of key variables and issues affecting, or likely to affect, all asset markets.

    Sydney Financial Planning Pty Ltd (ABN 29 606 413 254), trading as Sydney Financial Planning & Illawarra Financial Planning is an Authorised Representative & Credit Representative of Charter Financial Planning Limited, Australian Financial Services Licensee and Australian Credit Licensee.

    This article contains information that is general in nature. It does not take into account the objectives, financial situation or needs of any particular person. You need to consider your financial situation and needs before making any decisions based on this information. If you decide to purchase or vary a financial product, your financial adviser, and other companies within the AMP Group may receive fees and other benefits. The fees will be a dollar amount and/or a percentage of either the premium you pay or the value of your investments. Please contact us if you want more information. If you no longer wish to receive direct marketing from us you may opt out by contacting Sydney Financial Planning . You may still receive direct marketing from AMP as a product issuer, bringing to your attention products, offerings or other information that may be relevant to you. If you no longer wish to receive this information you may opt out by contacting AMP on 1300 157 173.

    Goldilocks stayed for 2024, but what’s in store for investors in 2025?

    Goldilocks stayed for 2024, but what’s in store for investors in 2025?

    Goldilocks stayed for 2024, but what’s in store for investors in 2025?

  • 2025 is likely to see positive returns, but after the surprisingcalm of 2024, it’s likely to be far more volatile (expect a 15%or so correction along the way) and more constrained.
  • Expect the RBA cash rate to fall to 3.6%, the ASX 200 to riseto 8800 and balanced super funds to return around 6%.
  • Australian home prices will likely see further softness aheadof rate cuts providing a boost in the second half of 2025.

  • Key things to keep an eye on are: interest rates; recessionrisk; a potential trade war; and the Australian consumer.
  • Another year of Goldilocks in 2024…

    2024 was like a rerun of 2023 with lots of angst but it turned out okay. Key big picture themes of relevance for investors were:

    1. Stronger than feared growth. Yet again the much feared recessionfailed to materialise. Despite the monetary tightening of 2022 and 2023 and China’s property collapse, global growth in 2024 remained just above 3%. In Australia, despite a “per capita recession”, economic growth remained positive albeit at only around 1% helped by strong population growth, stronger than expected growth in public spending and labour hoarding offsetting severe mortgage pain for some.
    2. Global divergence. Within emerging countries, India grew around 6.5%, China grew around 4.8% (which is slow for China) but South America and the Middle East only grew around 2%. And within developed countries, US growth remained strong at around 2.8% but growth was just 0.8% in Europe and around 0.3% in Japan.
    1. Further disinflation. Inflation in major countries has fallen sharply from peaks of 8 to 11% in 2022 to around 2 to 3% in 2024. Australia lagged on the way up and is doing the same on the way down.
    2. Falling interest rates. It took longer to get there & rates didn’t fall as much as expected at the start of the year but most major central bank started to cut their policy rates. The RBA should start early in 2025.
    3. Geopolitical threats were not as worrying as feared. In particular, the conflict in Israel widened to include Lebanon and missile exchanges with Iran but didn’t impact oil supplies and the oil price was little changed, the Cold War with China didn’t produce any majordisruptions and Donald Trump’s re-election boosted US shares.

    Global inflation graph

    Source: Bloomberg, AMP

    …resulted in strong returns for investors

    There were a few bumps along the way for shares – notably with an inflation scare in April and a growth scare into August – but they were relatively minor (with brief falls in shares off less than 10%). For diversified investors 2024 was another strong year.

    Investment returns for major asset classes

    Total return %, pre fees and tax 2023 actual 2024 actual* 2025 forecast
    Global shares (in Aust dollars) 23.3 27.9 7.0
    Global shares (in local currency) 23.2 23.6 7.0
    Asian shares (in local currency) 3.4 14.4 6.0
    Emerging mkt shares (local currency) 9.9 11.8 6.0
    Australian shares 12.4 15.1 7.0
    Global bonds (hedged into $A) 5.3 3.1 4.0
    Australian bonds 5.3 2.4 4.0
    Global real estate investment trusts 7.4 9.7 9.0
    Aust real estate investment trusts 17.6 26.0 6.0
    Unlisted non-res property, estimate -5.0 -6.0 2.0
    Unlisted infrastructure, estimate 5.0 6.5 7.0
    Aust residential property, estimate 9.5 8.0 4.0
    Cash 3.9 4.1 4.0
    Avg balanced super fund, ex fees and tax 9.3 11.8 6.0

    * Year to date to Nov. Source: Bloomberg, Morningstar, REIA, CoreLogic, AMP


    • Global shares had a strong year as rates fell, albeit less than expected, and profits were stronger than expected.
    • US shares outperformed reflecting its stronger economy, tech exposure and a boost from Trump’ s re-election promising US friendly policies. By contrast non-US shares underperformed, particularlyEurozone shares which weren’t helped by French politicaluncertainty. Chinese shares got a boost from more stimulus.
    • Australian shares did well in anticipation of stronger profits and rate cuts ahead but underperformed with China worries and no rate cut.
    • Government bond returns were constrained by smaller than expected rate cuts and worries about Trump’s policies driving higher inflation.
    • Real estate investment trusts saw solid returns in anticipation of better commercial property returns ahead.
    • Unlisted assets were constrained by the valuation effect of high bond yields with office property seeing losses from reduced space demand.
    • Australian home prices rose with the housing shortfall, but “high” rates saw gains stall into year end with prices falling in several cities.
    • The $A fell but mainly against the $US, with the latter rising on Trump’s tax cut, deregulation and tariff plans.
    • Reflecting all this, balanced super funds had very strong returns forthe second year in a row. They were roughly double our expectations!

    The key threats for 2025

    Just as was the case for 2024 the worry list for 2025 is long and maybe even more threatening given the uncertainty Trump’s policies pose:

    • Share valuations are less attractive, with the key US share markettrading on a 26 times forward PE and the earnings yield bond yield gap is negative. Australia is not so bad at 20 times but it’s not cheap.
    • Uncertainty remains around how much the Fed, the RBA and some other central banks will cut rates as core inflation is still not at target.
    • Bond yields could continue to rise on the back of Trump’s tax cut and tariff policies, placing pressure on shares.
    • The risk of recession remains, particularly in the US if rising bond yields prevent a recovery in manufacturing and housing and in Australia if the RBA leaves rates too high for too long.
    • A global trade war in response to Trump’s threatened tariffs could add to this risk particularly in Europe and Asia.
    • Risks for the Chinese economy are high and could be amplified as Trump ramps up tariffs & if Chinese policy stimulus remains modest. There are signs of bottoming in China’s property market though.
    • Geopolitical risk is high: “maximum pressure” from Trump to resolve the war in Ukraine and Iran’s nuclear aims could see the Ukraine and Middle East wars getting worse before they get better threatening higher oil prices; similarly tensions with China could escalate; politicaluncertainty will likely be high in Europe with issues around the French budget and another potential election and a German election in the first half (although the latter is likely to be benign with the centre right Christian Democrats likely to “win”); and the Australian election is due by May although it’s unlikely to lead to a radical change in economicpolicy but does run the risk of even more public spending.

    These considerations point to at least a high risk of increased volatility after the relative calm of 2024.

    Reasons for optimism in 2025

    However, despite these worries there are several grounds for optimism. First, inflation is likely to continue to trend down as labour markets are continuing to ease, demand growth is still slowing and commodity prices are in a mild downtrend from their 2022 high.

    Second, central banks are likely to continue cutting interest rates. This is likely to range from the Fed which will become more gradual and cut to around 3.75% to the ECB which is likely to cut to 1.5% (partly to offset the negative impact of a possible trade war and political uncertainty in France). This is expected to include the RBA where quarterly trimmed mean inflation is likely to soon drop to around 0.6-0.7%qoq (or 2.4-2.8% annualised), enabling it to possibly start cutting in February but by May at the latest taking the cash rate down to 3.6% by year end.

    Third, global growth is likely to slow in 2025 but only to just below 3% with US growth around 2.5% helped by optimism on Trump’s policies, Chinese growth around 5% with more stimulus offsetting a potential trade war with the US and Japanese and European growth around 1%. Global growth is likely to strengthen in the second half helped by rate cuts. Australian growth is likely to edge up to 1.8% helped by rising real wages, tax cuts & rate cuts and this should see profit growth return.

     Fourthly, if recession does occur it’s likely to be mild as most countries including Australia have not seen a spending boom that needs to be unwound and traditionally makes recessions deep. And the Chinese government is likely to continue to do just enough to keep growth around the 5% level. Currently global business conditions surveys are still around levels consistent with okay global growth.

    Global composite PMI vs world GDP

    PMIs are surveys of business conditions and confidence. Source: Bloomberg, IMF, AMP

    Finally, while Trump’s policies will create a lot of uncertainty and disruption as he uses tariffs and other things as part of a maximum pressure strategy to negotiate better outcomes for the US his first term as President tells us he ultimately wants to see shares up, not down. He was also elected on a mandate to get the cost of living down for Americans, not to push it up. This could ultimately mean more of a focus on his tax and efficiency policies as opposed to his populist measures like tariffs.

    Implications for investors

    In the absence of a tried and tested process, trying to time the market, ie, selling before falls and buying ahead of gains is very difficult. Many of the mistakes referred to above kick in and it can be a sure way to destroy wealth. Perhaps the best example of this is a comparison of returns if the investor is fully invested in shares versus missing out on the best days. Of course, if you can avoid the worst days during a given period you will boost your returns. But this is very hard and many investors only get out after the bad returns occur, just in time to miss out on some of the best days and so hurt their returns. If you were fully invested in Australian shares from January 1995, you would have returned 9.5% pa (including dividends but not allowing for franking credits). But if by trying to time the market you miss the 10 best days the return falls to 7.5% pa. If you miss the 40 best days, it drops to just 3.5% pa. Hence, it’s time in the market that’s the key, not timing the market. The last two years provide a classic example of how hard it is to time markets – there has been a long worry list, so it’s been easy to be gloomy but timing markets on the back of this has been a loser as shares put in strong gains.

    Just as trees don’t grow to the sky, 20% plus returns from global shares are not sustainable. So, we expect good investment returns over 2025, but it will likely be a rougher and more constrained ride than in 2024.

    • Global and Australian shares are expected to return a far more constrained 7% in the year ahead. Stretched valuations after twostrong years, the ongoing risk of recession, the likelihood of a globaltrade war and ongoing geopolitical issues will likely make for a volatile ride in 2025 with a 15% correction somewhere along the way highlylikely. But central banks still cutting rates with the RBA joining in andprospects for stronger growth later in the year supporting profits should still see okay investment returns.
    • Expect the ASX 200 to end 2025 at around 8,800 points.
    • Bonds are likely to provide returns around running yield or a bit more, as inflation slows to target, and central banks cut rates.
    • Unlisted commercial property returns are likely to start to improve next year as office prices have already had sharp falls in response to the lagged impact of high bond yields and working from home.
    • Australian home prices are likely to see further weakness over the next six months as high interest rates constrain demand and unemployment rises. Lower interest rates should help from mid-yearthough and we see average home prices rising by around 3% in 2025.

    The main things to keep an eye on are: interest rates; recession risk; a likely trade war; China’s property market; and the Australian consumer.

    Conclusion

    We wish all our clients a Merry Christmas and hope you take time to rest from our busy lives. Last Christmas, I warned of extra volatility, but great news—I was wrong! This year, we still expect some volatility. However, as interest rates decrease to stimulate a slowing economy, financial markets usually rise. As always, stick to the strategy we’ve built for you and ride the ups and downs, as over time, the ups outweigh the downs.

    We look forward to guiding you through 2025 and beyond!

    Bill Bracey
    CEO & Founder of Sydney Financial Planning


    What investment strategies are right for you?

    Arrange a meeting with one of our Financial Planners to help avoid common investment mistakes, either book a meeting or get in contact with us on 02 9328 0876.


    This article was prepared by Dr Shane Oliver with opening and closing summary by William Bracey – CEO & Senior Financial Planner from Sydney Financial Planning. Dr Shane Oliver who provides economic forecasts and analysis of key variables and issues affecting, or likely to affect, all asset markets. He also provides economic forecasts and analysis of key variables and issues affecting, or likely to affect, all asset markets.

    Sydney Financial Planning Pty Ltd (ABN 29 606 413 254), trading as Sydney Financial Planning & Illawarra Financial Planning is an Authorised Representative & Credit Representative of Charter Financial Planning Limited, Australian Financial Services Licensee and Australian Credit Licensee.

    This article contains information that is general in nature. It does not take into account the objectives, financial situation or needs of any particular person. You need to consider your financial situation and needs before making any decisions based on this information. If you decide to purchase or vary a financial product, your financial adviser, and other companies within the AMP Group may receive fees and other benefits. The fees will be a dollar amount and/or a percentage of either the premium you pay or the value of your investments. Please contact us if you want more information. If you no longer wish to receive direct marketing from us you may opt out by contacting Sydney Financial Planning . You may still receive direct marketing from AMP as a product issuer, bringing to your attention products, offerings or other information that may be relevant to you. If you no longer wish to receive this information you may opt out by contacting AMP on 1300 157 173.

    Recession fears & share market falls

    Recession fears & share market falls – what it means for the RBA & investors?

    Recession fears & share market falls

  • The RBA should be considering cutting interest rates.
  • Share market volatility is here but the best approach for most investors is to stick to a long-term strategy.
  • Introduction

    Share markets have seen big falls on the back of rising recession fears. For the last two years there has been constant fears of a recession – or a contraction in economic activity – on the back of central bank rate hikes. With it failing to materialise and inflation falling enabling central banks to pivot to rate cuts many thought it would be avoided, and shares surged to record highs into July. However, recession fears are now back with a vengeance, particularly in the US, so share markets have fallen sharply from their highs – with the key direction setting US share market down 8.5% and global shares off 8.9% and Australian shares having a 5.7% fall from its high last week. The following week the share markets fully recovered and did a complete turnaround recovering all losses. Volatility!

    More US recession indicators flashing red

    The basic argument for recession over the last two years is that the most rapid monetary tightening in major countries in decades and cost-of-living pressures would depress spending driving a recession. Indeed, the Eurozone, UK and Japan have seen growth stall or arguably have had mild recessions over the last 18 months and Australia is already in a “per capita recession” (with falling GDP per person) even though GDP has still been rising. But the US economy has been robust, and this has kept the key direction setting US share market strong until recently. However, while the US economy has been stronger than expected, the risk of recession never fully went away, with key indicators highlighting ongoing recession risk. In particular:

    • The US yield curve which is a guide to whether monetary policy is tight or loose has been flashing red, with short term interest rates above long-term rates, since 2022. And while this has given false signals it has preceded all US recessions over the last 60 years. It’s still inverted and so its recession signal remains.
    • The US leading economic index – which combines things like building permits & confidence – has had a fall consistent with past recessions.

    US yield curve

    Shading shows recessions defined by the US National Bureau of Economic Research. Source: Bloomberg, AMP

    There is nothing new here. And with global growth running around average levels, business conditions indicators remaining solid and US growth still strong many concluded the recession indicators just got it wrong. However, the resilience in economic growth could have just been due to (what Milton Friedman long ago called) the “long and variable lags” with which monetary policy impacts economic activity. And the impact of rate hikes was stretched out this time by the reopening boost from the pandemic, household saving buffers built up in the pandemic and strong labour markets partly reflecting a shortage of workers.

    These supports are now fading. Weakening US jobs data suggest that it may indeed have been long lags at work. US job openings and people quitting for new jobs have been falling for some time now. Initially this may have been benign as slowing labour demand just pushed down job openings (and wages growth) but with unemployment remaining low.

    US job opening and quits

    Source: Bloomberg, AMP

    However, now falling labour demand is showing up in higher unemployment. Historically, small increases in US unemployment tend to be benign but once it goes beyond 0.5 percentage points it tends to keep rising and become associated with a recession as higher unemployment leads to lower spending in the economy.

    Based on this a US economist named Claudia Sahm observed that whenever the 3-month moving average of the unemployment rate rises by 0.5% above its prior 12 month low a recession has been underway. This has become known as the Sahm Rule and it was triggered by July jobs data in the US on Friday with unemployment spiking to 4.3%, up from a low of 3.4%. It can be seen at work in the next chart. It has a perfect track record, but relationships that work in the past don’t always work in the future and it may have been distorted by a lumpy 420,000 rise in the labour supply in July.

    That said it’s hard to ignore and suggests along with the still inverted US yield curve and the slump in the US leading indicator that recession risk is now very high in the US. Which is why share markets have plunged and the US money market is now back to allowing nearly 5 rate cuts this year. Recall it was expecting nearly 7 cuts early this year, so it’s almost gone full circle!

    US unemployment rate recessions

    Shading shows recessions as defined by the US NBER. Source: Bloomberg, AMP

    What about Australia?

    Leading indicators of Australian economic growth have not been as weak as those in the US. However, there are several reasons for concern that Australia may follow the US. We put the risk of recession here at 50%:

    • Interest rates have gone up by more in Australia than in the US as measured by the mortgage rates people actually pay.
    • Household debt servicing costs are now at a record share of household income in Australia (which is not the case in the US), and Australia has far more overvalued housing than in the US.
    • Australian real household spending has slowed to a crawl.
    • The boost to Australian economic growth from record population growth looks set to slow over the year ahead by at least one percentage point. This will more than offset the boost from tax cuts.

    Australian employment vs jobs leading indicator

    Source: ABS, AMP

    • Like in the US job vacancies have been falling here for two years and this will likely soon feed through to a sharp slowdown in jobs growth and rise in unemployment which is already up to 4.1% from 3.5%.
    • US recession will drag down global growth which will mean less demand for our exports and indirectly impact via confidence.

    Have central banks, including the RBA, got it wrong?

    The global monetary policy easing cycle is now underway. However, while lower interest rates are good for shares, this is less so initially in a recession and share markets are signalling increasing concern central banks may have left it too late. Central banks, including the RBA, may not have allowed enough for the “long and variable lags” with which rate hikes impact growth and inflation and so overtightened or left rates too high. This has likely been made worse by the pause in progress getting inflation down over the last six months in the US and then in Australia. Because central banks never know when they have raised rates enough to control inflation they often go too far – resulting in recession. This was the case prior to recessions in Australia in the early 1980s and 1990s. While the RBA still faces inflation that’s too high, given the US experience it should now be giving consideration to a cut in interest rates as it now risks much higher unemployment and inflation falling below target.

    What will recession mean for Australians?

    A recession normally sees higher unemployment – the early 1980s and 1990s recessions saw a 5 percentage point rise, less job security, lower wages bargaining power, a fall in living standards and low confidence. Recessions eventually also mean lower growth in the cost of living and often lead to lower levels of immigration and less household formation which could take pressure off rents and home prices.

    What would be the impact on shares?

    Recessions in Australia and the US have tended to be associated with bear markets in shares, ie, 20% or more falls, as they drive a slump in profits. The next chart shows the Australian share market and falls in it against US recessions. Shares are vulnerable now as valuations are stretched, investor sentiment has been high, geopolitical risk is high with the US election and escalating problems in the Middle East and August and September are often rough months. So, it’s likely too early to buy the dip!

    Equity bear markets recession

    Shading shows recessions as defined by the US NBER. Source: ASX, Bloomberg, AMP


    Bill’s Conclusion

    Over the past 18 months, my previous newsletters have highlighted the expectation of increased volatility. We are witnessing it now. Two weeks ago, Warren Buffett sold half of his Apple shares, causing the US share market to drop by 5% over a few days. It then fully recovered as the nervous investors sold, and the smart money bought at a 5% discount. I never like paying full price for anything, and neither should you.

    Be prepared for more volatility as our economy starts to slow down, with elections coming up in the US soon and in Australia next year. Interest rates will need to decrease to stimulate the economy. This is beneficial for the share market because, as interest rates go down, share markets generally go up. However, lower interest rates indicate a slowing economy, which is evident in Australia, the US, and China.

    In conclusion, be aware that we are heading for increased volatility. Remember, don’t panic; instead, look for opportunities to buy at lower prices. As an advised client, your portfolio has been prepared for such outcomes.

    Volatility is a normal, but uncomfortable, it’s part of the economic cycle. The key is not to try to time the market but to maintain a well-managed, well-diversified, and well-advised strategy and portfolio.

    Be sure to consult with your adviser!

    Remember “Be fearful when others are greedy and be greedy when others are fearful.” – Warren Buffet aged 93

    Still the smartest investor I look up to.

    Bill Bracey
    CEO & Founder of Sydney Financial Planning


    Will your investment strategy weather the expected volatility?

    Speak with one of our Financial Planners about the best approach for your circumstances, either book a meeting or get in contact with us on 02 9328 0876.


    This article was prepared by Dr Shane Oliver with opening and closing summary by William Bracey – CEO & Senior Financial Planner from Sydney Financial Planning. Dr Shane Oliver who provides economic forecasts and analysis of key variables and issues affecting, or likely to affect, all asset markets. He also provides economic forecasts and analysis of key variables and issues affecting, or likely to affect, all asset markets.

    Sydney Financial Planning Pty Ltd (ABN 29 606 413 254), trading as Sydney Financial Planning & Illawarra Financial Planning is an Authorised Representative & Credit Representative of Charter Financial Planning Limited, Australian Financial Services Licensee and Australian Credit Licensee.

    This article contains information that is general in nature. It does not take into account the objectives, financial situation or needs of any particular person. You need to consider your financial situation and needs before making any decisions based on this information. If you decide to purchase or vary a financial product, your financial adviser, and other companies within the AMP Group may receive fees and other benefits. The fees will be a dollar amount and/or a percentage of either the premium you pay or the value of your investments. Please contact us if you want more information. If you no longer wish to receive direct marketing from us you may opt out by contacting Sydney Financial Planning . You may still receive direct marketing from AMP as a product issuer, bringing to your attention products, offerings or other information that may be relevant to you. If you no longer wish to receive this information you may opt out by contacting AMP on 1300 157 173.

    2024 – a list of lists regarding the macro investment outlook

    2024 – a list of lists regarding the macro investment outlook

    2024 – a list of lists regarding the macro investment outlook

  • 2024 is likely to see positive returns helped by falling rates but they are likely to be more constrained and volatile given risks around the timing of rate cuts, recession risks and geopolitics. The risk of recession in Australia is around 40%.
  • We expect the RBA to cut the cash rate later in the year and as such expect the ASX and balanced super funds to rise off the back of this. Australian residential property prices are likely to soften ahead of support from rate cuts.
  • The key things to watch are: inflation and rates; the risk of recession; China; US politics; and the Australian consumer.
  • Introduction

    Happy New Year, it’s the 35th year I’ve been sending this opening year economic outlook, each additional year of experience providing me greater perspective on how investment markets behave and what successful clients need to do to build wealth.

    Simply put, clients need the right financial plan and strategy, holding only quality assets, coupled with the right Financial Planning firm who deliver on their promises, who coach you to ride the storms out and provide a yearly review to measure and acknowledge progress and reset for the following year.

    This time last year, I warned clients to expect higher volatility, and we sure got that right! I also noted that once interest rates start to fall share markets will rebound, then later followed by the property market. Sounds easy, but you need to hold your nerve!

    Now its slowly starting, these things take time to flow through, there is always volatility, but it will reduce in time. Those who don’t have a trusted financial planner to guide them through the cycles never seem to build wealth, as they continue to make terrible emotional financial decisions that destroys wealth.

    After poor returns in 2022 on the back of high and rising inflation, a surge in interest rates, the invasion of Ukraine and recession worries, 2023 was a far better year for investors as inflation fell and investment markets anticipated lower interest rates ahead. This saw average balanced growth superannuation funds return around 9.5% more than making up for the 4.8% loss in 2022, as both shares and bonds rallied. Over the last five years, they returned around 7.5% pa, which exceeded inflation.

    Balanced growth superannuation fund returns

    Source: Mercer Investment Consulting, Morningstar, AMP

    Can the rebound continue or will markets have a rough year? Here is a simple point form summary of key insights and views on the outlook.

    Five key themes from 2023

    • Stronger than feared growth. Despite fears recession was inevitable, on the back of rate hikes, it’s been avoided so far, helped by saving buffers, reopening boosts and some labour hoarding.
    • Disinflation. Inflation across major countries fell from peaks of 8 to 11% in 2022 to around 3 to 5% as supply pressure and demand eased.
    • Peak interest rates. Most major central bank policy rates look to have peaked and this probably includes the RBA’s cash rate.
    • Geopolitical threats proved not to be as worrying as feared.
    • Artificial intelligence hit the big time after the launch of Chat GPT. Thishelped tech stocks (mostly US) tech stocks reverse their 2022 slump.

    Five lessons for investors from 2023

    • Monetary policy still works in controlling inflation – the lags may be long and variable but this time was not really different. Of course, an easing in supply chain disruptions helped and there is still a way to go.
    • Don’t ignore population growth – a surge in immigration played a big role in pushing home prices back up and avoiding recession in Australia.
    • Timing markets is hard – it was easy to be gloomy a year ago with a long worry list and shares plunging into October but timing markets on the back of this was a loser as shares surged, putting in strong returns.
    • Geopolitics matters – but it’s hard to predict (eg, Hamas’ attacks on Israel) and the impact can often be less than feared, with the world learning to live with the war in Ukraine and the Israel/Hamas war not (yet) causing a surge in oil prices.
    • Turn down the noise – investors are being hit with often irrelevant, low quality & conflicting information which boosts uncertainty. The key is to turn down the noise and stick to a long-term strategy.

    The three big worries for 2024

    • Inflation is still too high and its decline is likely to remain bumpy – so central banks could still have another hawkish turn and even if not there is a high risk that rate cuts may come later than markets expect.
    • The risk of recession is high. It’s hard to see the biggest rate hiking cycle since the 1980s not having a major impact and the risks are already evident in tighter US lending standards, falling lending in Europe and stalling consumer spending in Australia. Risks around the Chinese economy and property sector also remain high.
    • Geopolitical risk is high: with half the world’s population seeing elections including the US, EU & India; the US Government could have a shutdown starting 19 January & could have another divisive Biden v Trump presidential election; the result of Taiwan’s 13 January election could see an easing or an escalation of tensions with China depending who wins; the war in Ukraine is continuing; and there is a high risk the Israel/Hamas war could spread, threatening oil supplies, particularly with Iran’s proxy Houthi rebels disrupting Red Sea shipping.

    Four reasons for optimism

    • Inflation has eased sharply to around 3% in major industrial countries and around 5% in Australia and is likely to continue to fall as: supply chain pressures have eased; demand is cooling; and labour markets are easing. This includes in Australia which lagged US inflation on the way up and is just doing so again on the way down.
    • We expect the ECB to start cutting rates in March, followed by the Fed and BoC in the June quarter. While there is still a high risk of one more hike in Australia in February, falling inflation should head this off so our base case is that the RBA has peaked ahead of rate cuts from June, taking the cash rate down to 3.6% by year end. Just as rate hikes were bad for shares in 2022, rate cuts should ultimately be positive.
    • While recession is a high risk and markets are no longer priced for it, if it does occur it should be mild: most countries have not seen a spending boom that needs to be unwound; in Australia consumer spending, housing investment and business investment are not running at excessive levels relative to GDP; and Chinese growth is soft and property sector risks are high, but it’s likely to target roughly 5% GDP growth again and back this up with fiscal stimulus if need be.
    • Finally, while there’s lots of geopolitical risks they may not turn out so badly: the US has a strong incentive to avoid an escalation in the Israel/Hamas war; the Ukraine war could turn into a frozen conflict; & elections won’t necessarily go in an adverse direction for markets. In relation to the US, the presidential election year normally sees average share returns and Trump could falter before the election.

    Key views on markets for 2024

    Easing inflation pressures, central banks moving to cut rates and prospects for stronger growth in 2025 should make for okay returns in 2024. However, with growth still slowing, shares historically tending to fall during the initial phase of rate cuts, a very high risk of recession and investors and share market valuations no longer positioned for recession, it’s likely to be a rougher and more constrained ride than in 2023. We expect balanced growth super funds to return positively and in line with benchmarks this year.

    • Global shares are expected to return positively and in line with benchmarks. The first half could be rough as growth weakens, but shares should ultimately benefit from rate cuts and lower bond yields and the anticipation of stronger growth later in the year and in 2025.
    • Australian shares are likely to outperform global shares, after underperforming in 2023 helped by somewhat more attractive valuations. A recession could threaten this though so it’s hard to have a strong view. Expect the ASX 200 to end 2024 well ahead of the start of the year.
    • Bonds are likely to provide returns around running yield or a bit more, as inflation slows, and central banks cut rates.
    • Unlisted commercial property returns are likely to be negative again due to the lagged impact of high bond yields & working from home.
    • Australian home prices are likely to fall slightly as high rates hit demand & unemployment rises. The supply shortfall should prevent a sharper fall & expect a wide dispersion. Rate cuts will help later in the year.
    • Cash and bank deposits are expected to provide returns of over 4%.
    • A rising trend in the $A is likely taking it above $US0.70, due to a fall in the overvalued $US and the Fed cutting rates more than the RBA.

    Five points on Bitcoin

    • Bitcoin rose 157% through 2023.
    • However, this followed a 64% fall in 2022, so it remains very volatile.
    • It and other crypto currencies remain highly geared to US shares and expectations for interest rates – explaining its sharp fall in 2022 when shares fell and rates rose and rebound with shares in 2023.
    • Bitcoin is yet to find a clear use (beyond as something to speculate in) making it very hard to value fundamentally – unlike, say, property which provides rents and shares which provide earnings. Recent gains owe partly to excitement around this year’s “halving” (in the amount of Bitcoin that miners receive) and anticipation of an exchange traded fund that can invest in Bitcoin – rather than developments in its use.
    • There is value in blockchain technology (for decentralised finance, contracts, etc) which is positive for cryptocurrencies like Ethereum, but this is hard to value.

    Five things to watch

    • Inflation – if it fails to continue falling as we expect, central banks will be more hawkish than we are allowing for, risking deep recession.
    • Recession – a mild recession should be manageable but a deep recession will mean significant downside in shares.
      So far global business conditions PMIs are soft but consistent with okay growth.

    Global Composite PMI vs world GDP

    Source: Bloomberg, IMF, AMP

    • The Chinese economy – China’s property sector is continuing to struggle and without measures to support consumers this could hurt its economy with a flow on to demand for Australian exports.
    • Geopolitics – the key risks relate to Taiwan, a possible expansion of the Israel/Hamas war and the US Presidential election.
    • The Australian consumer – consumer spending has slowed sharply and risks stalling as a result of cost-of-living pressures, high interest rates and higher unemployment.

    Nine things investors should remember

    • Make the most of compound interest to grow wealth. Saving regularly in growth assets can grow wealth significantly over long periods.
    • Using the “rule of 72”, it will take 16 years to double an asset’s value if it returns 4.5% pa (ie, 72/4.5) but only 9 yrs if the asset returns 8% pa.
    • Don’t get thrown off by the cycle. Falls in asset markets can throw investors of a well-considered strategy, destroying potential wealth.
    • Invest for the long-term. Given the difficulty in timing market moves, for most it’s best to get a long-term plan that suits your wealth, age and risk tolerance and stick to it.
    • Diversify. Don’t put all your eggs in one basket.
    • Turn down the noise. This is critical with the information overload coming from social and mainstream media, with plenty of clickbait.
    • Buy low, sell high. The cheaper you buy an asset, the higher its prospective return will likely be and vice versa.
    • Avoid the crowd at extremes. Don’t get sucked into euphoria or doom and gloom around an asset.
    • Focus on investments you understand offering sustainable cash flow. If it looks dodgy, hard to understand or has to be justified by odd valuations or lots of debt, then stay away. There is no free lunch!
    • Seek advice. Investing can get complicated and its often hard to stick to a long-term investment strategy on your own.

    Closing Summary

    So, in closing its remains critically important to continue to review your strategy every year, as everything in the world continues to change, you just may not be able to see it from where you are.

    Make sure when we reach out to you via our new Calendly review booking system you lock in a meeting time.

    Time will not stand still, nor will your wealth creation strategy needs.

    Bill Bracey
    CEO and Founder


    Will your wealth creation strategy stand the test of time?

    Speak with one of our Financial Planners about the best approach for your circumstances, either book a meeting or get in contact with us on 02 9328 0876.


    This article was prepared by Dr Shane Oliver with opening and closing summary by William Bracey – CEO & Senior Financial Planner from Sydney Financial Planning. Dr Shane Oliver who provides economic forecasts and analysis of key variables and issues affecting, or likely to affect, all asset markets. He also provides economic forecasts and analysis of key variables and issues affecting, or likely to affect, all asset markets.

    Sydney Financial Planning Pty Ltd (ABN 29 606 413 254), trading as Sydney Financial Planning & Illawarra Financial Planning is an Authorised Representative & Credit Representative of Charter Financial Planning Limited, Australian Financial Services Licensee and Australian Credit Licensee.

    This article contains information that is general in nature. It does not take into account the objectives, financial situation or needs of any particular person. You need to consider your financial situation and needs before making any decisions based on this information. If you decide to purchase or vary a financial product, your financial adviser, and other companies within the AMP Group may receive fees and other benefits. The fees will be a dollar amount and/or a percentage of either the premium you pay or the value of your investments. Please contact us if you want more information. If you no longer wish to receive direct marketing from us you may opt out by contacting Sydney Financial Planning . You may still receive direct marketing from AMP as a product issuer, bringing to your attention products, offerings or other information that may be relevant to you. If you no longer wish to receive this information you may opt out by contacting AMP on 1300 157 173.

    SFP Investment Outlook Q&A - February 2022

    SFP investment outlook Q&A – February 2022

    SFP Investment Outlook Q&A - February 2022

  • Wages growth is likely to pick up to 3% this year.
  • A Russian invasion of Ukraine risks a short term hit to shares followed by recovery over the next 3 to 12 mths.
  • Introduction

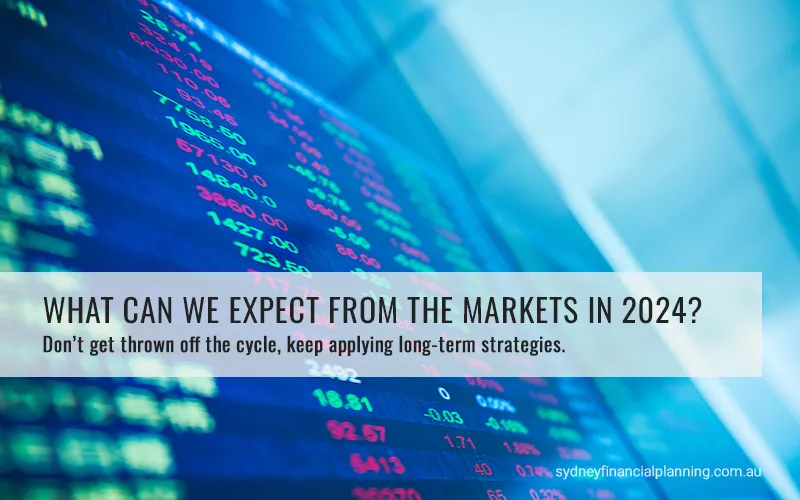
    This note covers the main questions investors commonly have regarding the investment outlook in a simple Q&A format.

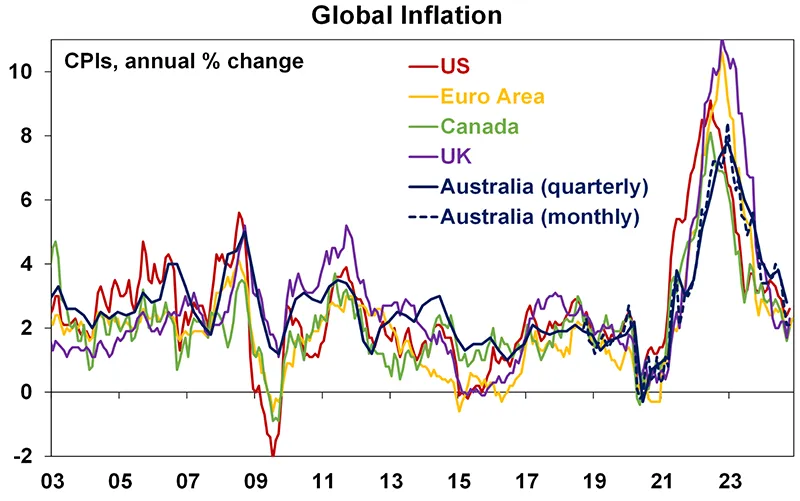
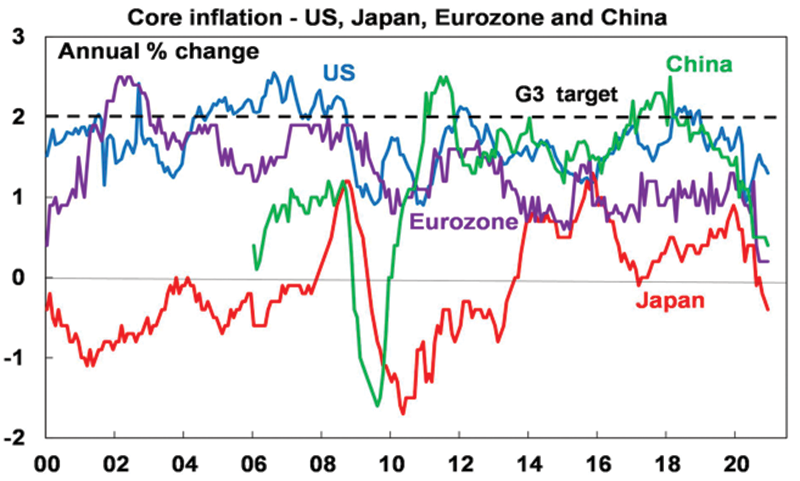
    Is the rise in inflation temporary or permanent?

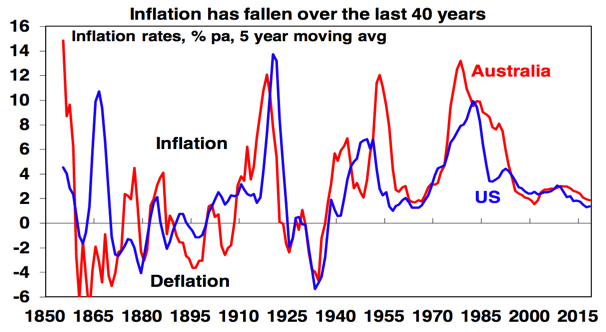
    I suspect it’s a bit of both. Much of the rise in inflation (to a 40 year high in the US and to 3.5%yoy in Australia) can be traced to distortions caused by the pandemic which boosted goods demand and restricted supply (both of goods & workers). Global energy prices are also being boosted by geopolitical tensions (notably in Europe). As consumer demand rebalances back to services, workers return and production catches up to demand, inflation should subside over the next 12 months or so.

    However, underlying inflation is unlikely to fall back to pre-pandemic lows and risks running above central banks targets over the next 5-10 years: we are now seeing much easier monetary and fiscal policy & many of the structural forces that drove low inflation look to be going in reverse: globalisation is in retreat; the ratio of workers to consumers is in decline; and we are now seeing bigger more interventionist government.

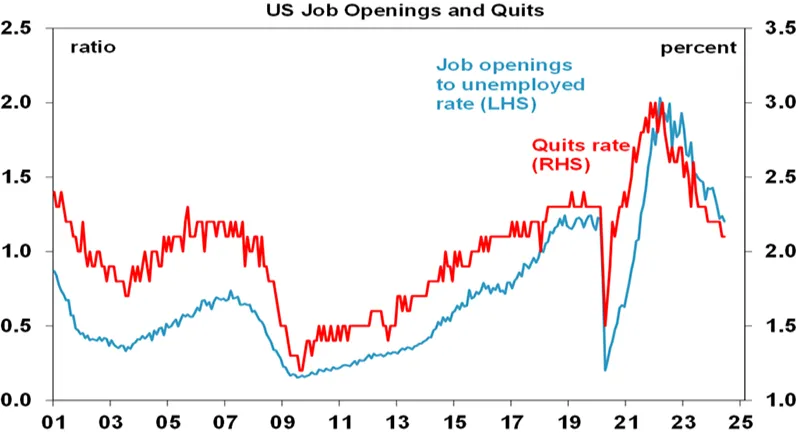
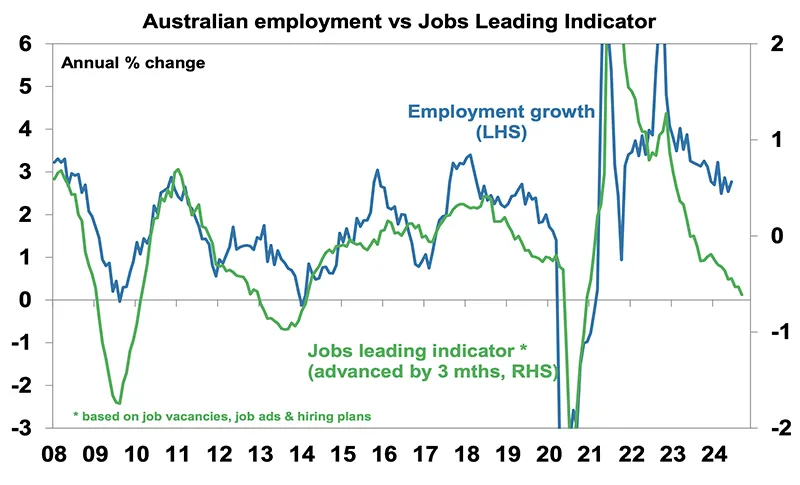
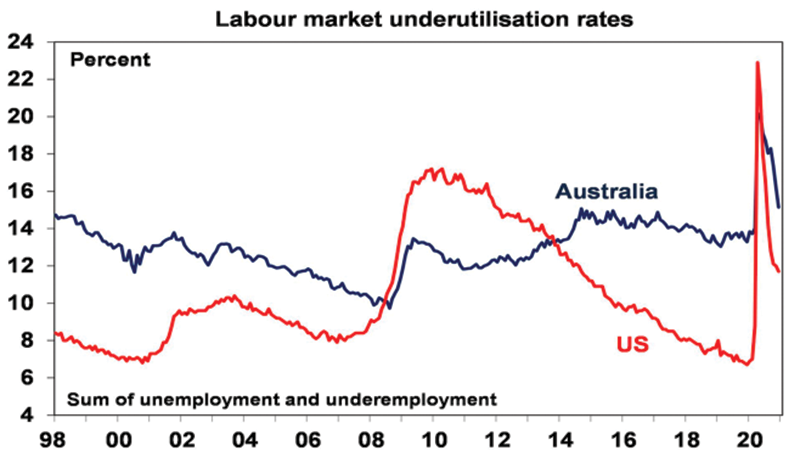
    Will wages growth rise too?

    Wages growth has already lifted to 4-5% yoy in the US, depending on the measure. But it has higher inflation and has seen less workers return through the reopening than in Australia. Nevertheless, numerous signs point to faster wages growth in Australia: the jobs market is tight, pushing towards full employment; various business surveys point to rising labour costs; ABS data shows payroll wages accelerating relative to jobs; and there are numerous anecdotes of wage pressure. We expect wages growth to rise to a 3% annual pace by mid-year.

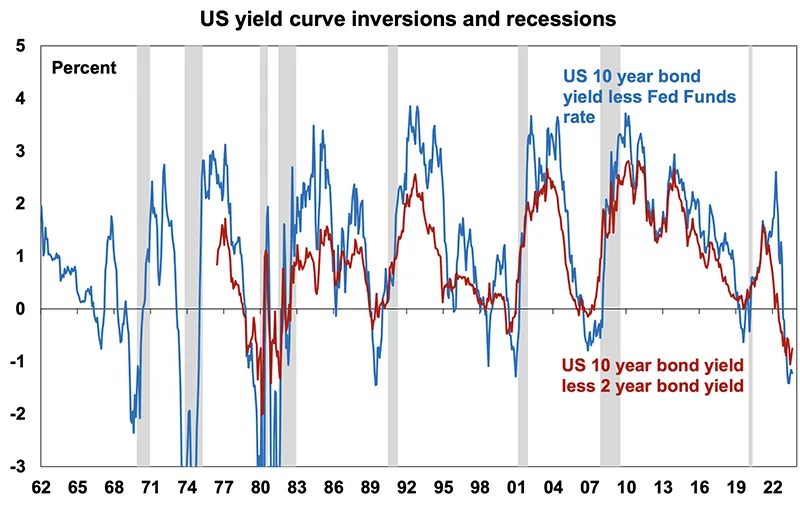
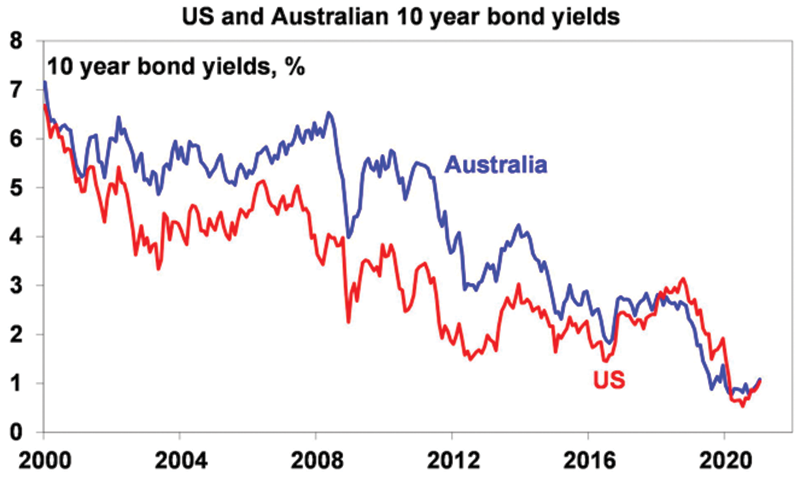
    How high will Australian interest rates rise?

    We expect the RBA to start raising the cash rate in August (possibly June) after news of more strong inflation data, unemployment below 4% and wages growth pushing up to 3% and see the cash rate rising to around 1.5 to 2% over the next two years or so. This would add a similar amount to variable mortgage rates. It will take household debt interest payments relative to income back to around 2018 levels. Higher household debt to income levels relative to the past and compared to say, the US, along with falling house prices will allow the RBA to proceed cautiously in raising rates through next year and see rates peak at lower levels compared to the past. Australia also has half the US’s inflation rate.

    Will the end of QE & rate hikes be a double whammy?

    Not really. Bond buying by central banks (or Quantitative Easing) was an alternative to cutting rates when rates had hit zero. With economic activity recovering and inflation up, it makes sense to end it and begin the withdrawal of the liquidity that was pumped in via QE (ie start quantitative tightening). But central banks can manage this with rate hikes to make sure the overall tightening in monetary conditions is not excessive.

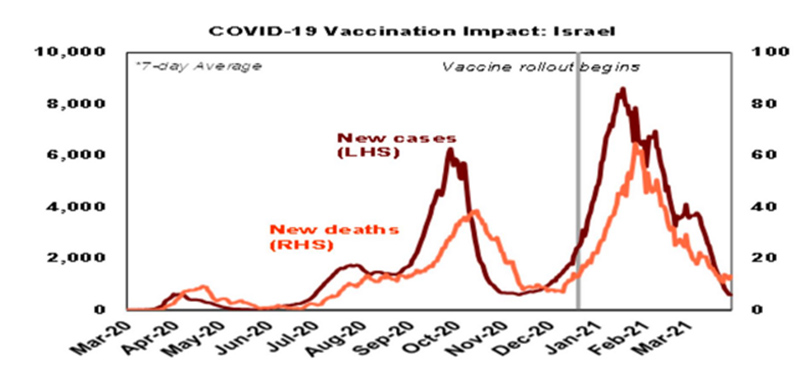
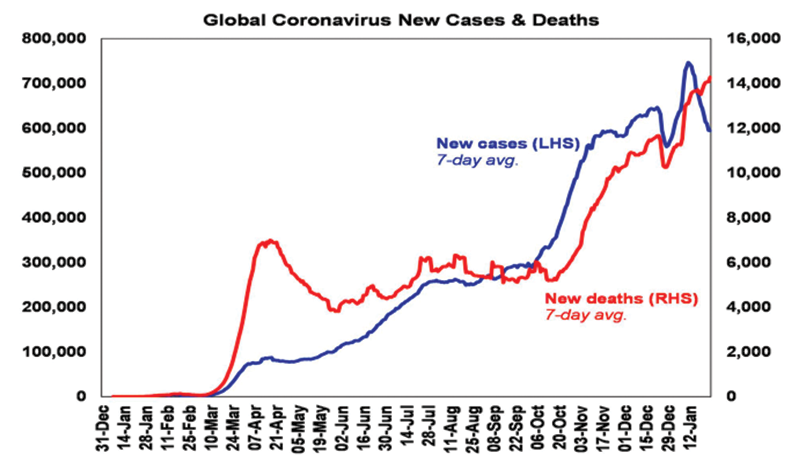
    Is coronavirus no longer an economic concern?

    Not quite, but nearly. Starting last year each successive covid wave seems to have had progressively less economic impact. This reflects a combination of vaccines, new treatments and recent covid variants being less harmful which has combined to enable reopening to continue. While the risk remains of a new variant which is more harmful, causing a setback, coronavirus could finally be moving from a pandemic to being endemic.

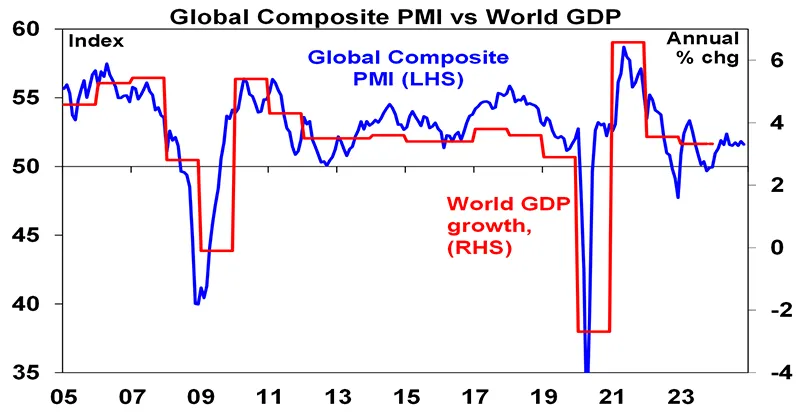
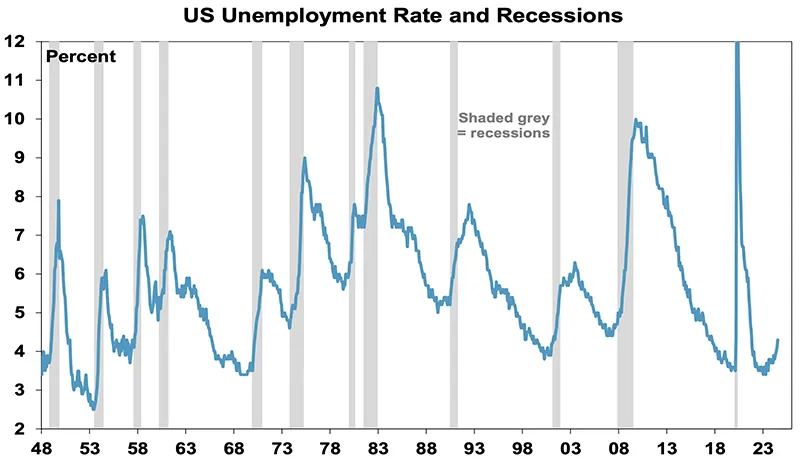
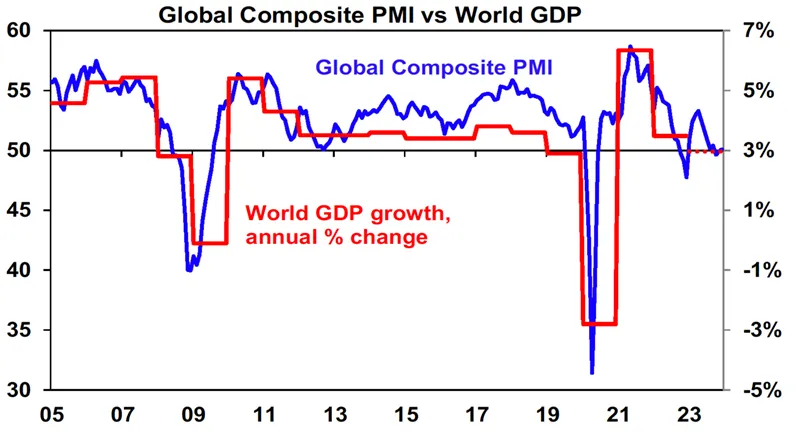
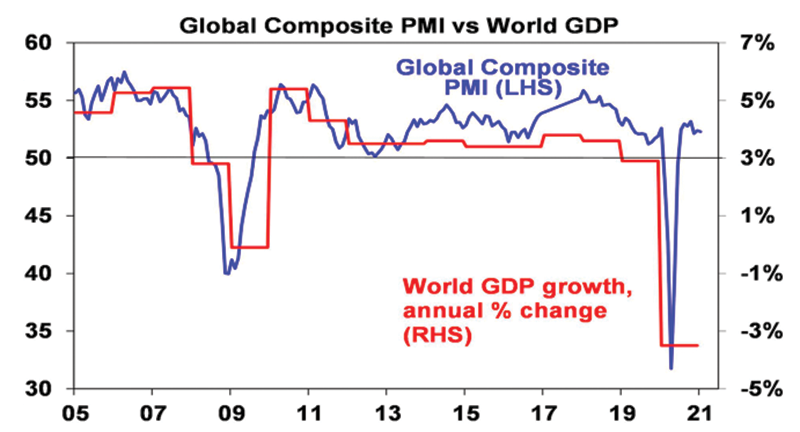
    Is the economic recovery on track?

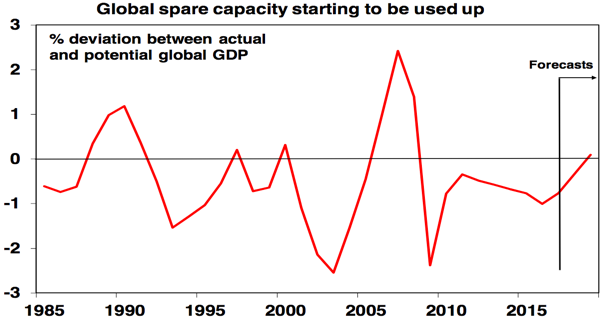
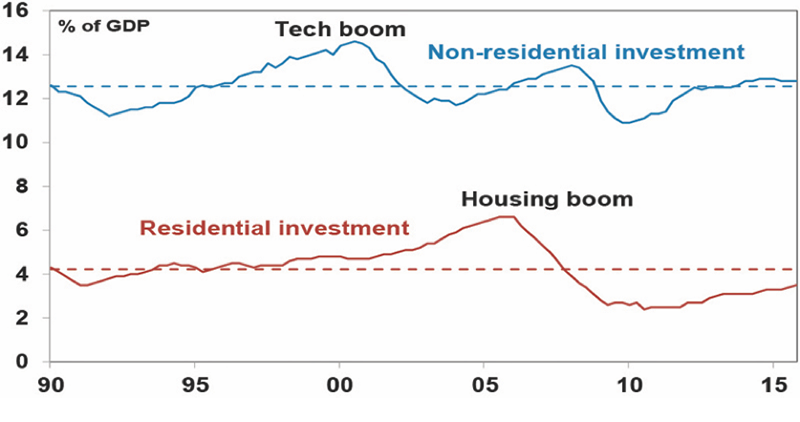
    While supply side constraints, monetary tightening, geopolitical threats and covid will constrain global and Australian economic growth, it will still be reasonable at around 4.5% this year. Key drivers are likely to be: ongoing reopening; pent up demand and excess savings; still easy monetary policy; strong business investment; and low inventory levels.

    How would a Russian invasion of Ukraine impact investment markets?

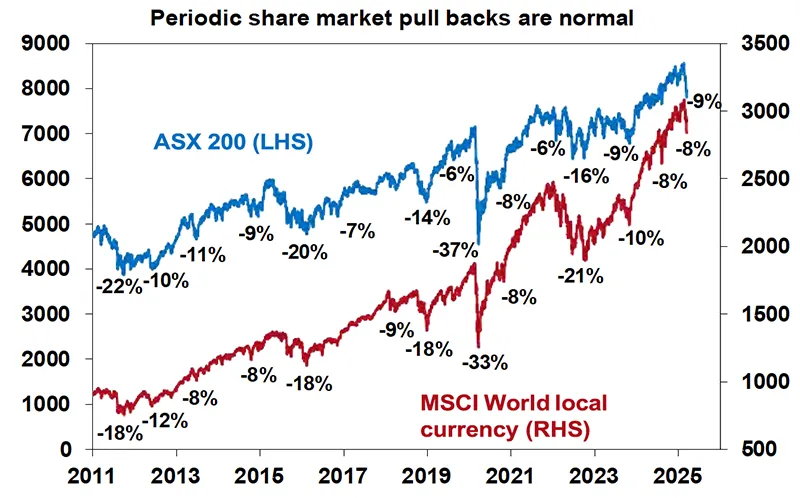
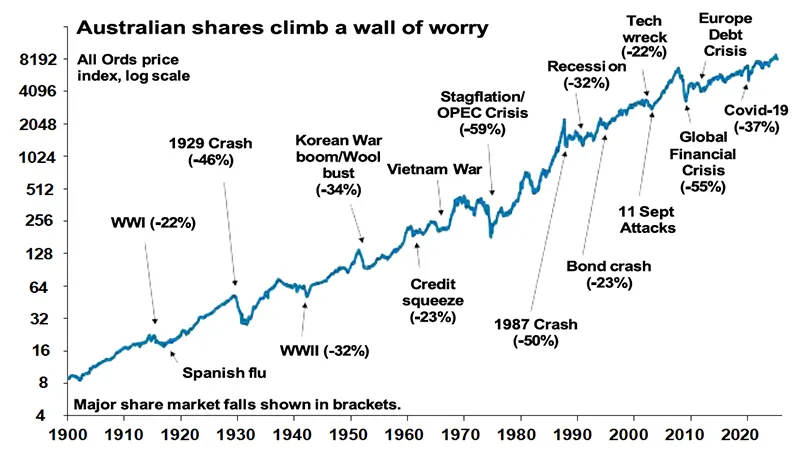
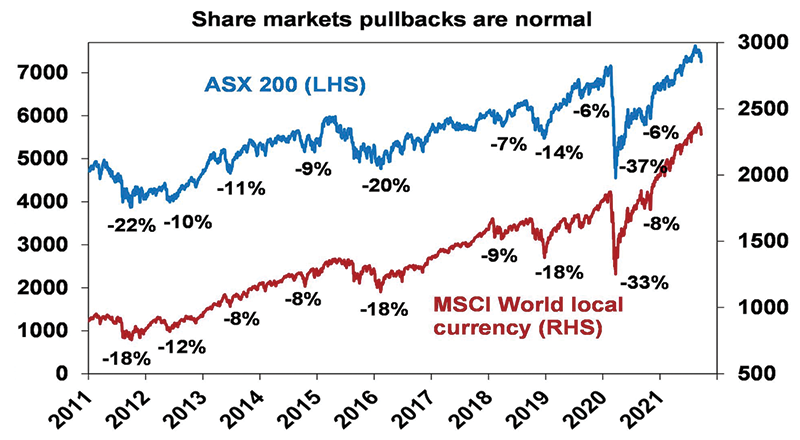
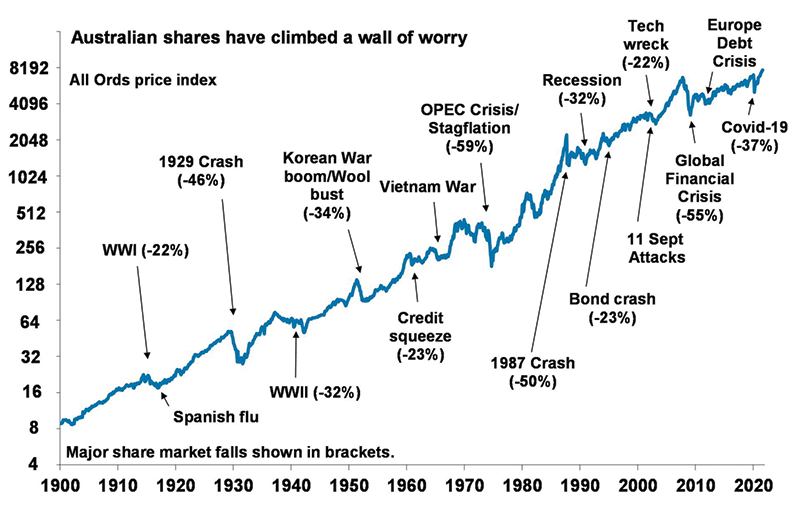
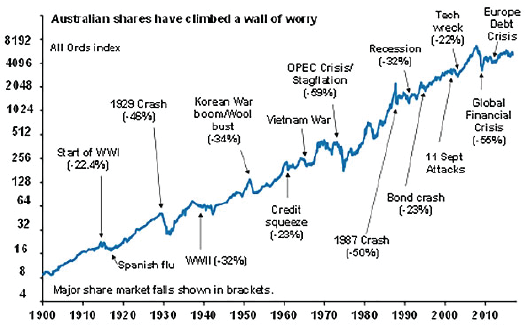
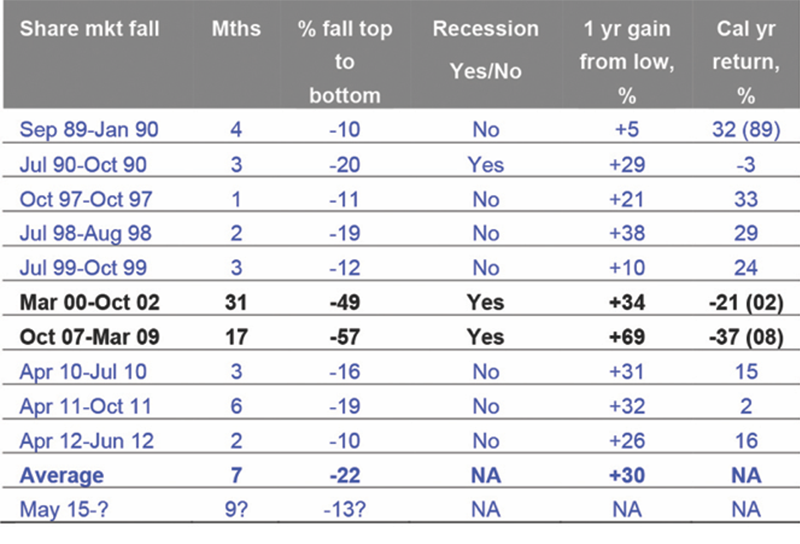
    Russia has been building up its military presence on the Ukraine border and is demanding that Ukraine never join NATO and NATO not station strategic weapons there. Negotiations have made little progress as the US fears consequences in other parts of the world if NATO does not stand tough. If anything, tensions have worsened as NATO has been shoring up Ukrainian defences and Russia has built up more military assets around it, with the US warning of possible imminent invasion. However, Russia has signalled it will continue with talks. Of course, there is a long history of various crisis events impacting share markets (major events in wars, terrorist attacks, financial crisis, etc) and the pattern is the same – an initial sharp fall followed by a rebound. Based on multiple crisis since 1907 Ned Davis Research found an average decline of 7% in the US share market from such events, but 6 months later the market is up 10% on average and 1 year later its up around 15%. Put very simply, there are four scenarios:

    1. Russia stands down – this would provide a very brief boost for share markets, including Australian shares (eg +1%).
    2. Russia moves in to occupy the Donbas (which is already controlled by Russian separatists) with sanctions from the west but not so onerous that Russia cuts of gas to Europe – this could see a brief hit to markets (say -2-4%) like in the 2014 Ukraine crisis but it would soon be forgotten about.
    3. Russian invasion of all of Ukraine with significant sanctions and Russia stopping gas to Europe (causing a stagflationary shock to Europe & possibly globally as oil prices rise further) but no NATO military involvement – this could see a bigger hit to markets (say -10%) but then recovery over six months.
    4. Invasion of all of Ukraine with significant sanctions, gas supplies cut & NATO military involvement – this could be a large negative for markets (say -15-20%) as war in Europe, albeit on its edge, fully reverses the “peace dividend” of the 1990s. Markets may then take 6-12 months to recover.

    Scenario 1 is still possible & it’s hard to see Russia undertaking a full invasion of Ukraine given the huge cost it would incur, let alone NATO troops being involved, but some combination of scenarios 2 and 3 are possible. But the history of such events points to an initial hit to shares, followed by a rebound.

    What is the threat posed by global geopolitical tensions – including those with China?

    Geopolitical issues have been building since the GFC and seemed to get a push along by the pandemic. The key drivers have been: a populist backlash against economically rationalist policies; the declining relative power of the US; and the polarising impact of social media. The most pressing are those with Russia (see above), China (in relation to Taiwan and trade with Australia) and Iran (in relation to its nuclear ambitions and oil supply). Although hard to time, they all make for a potentially more volatile ride in markets and possibly contribute to a less favourable return environment as they threaten higher inflation and less globalisation. It should be noted though that the economic impact of Australia’s tensions with China has been minor to date as most of the exports impacted were fungible commodities and able to find other markets. The same may apply in relation to iron ore if the adjustment occurs slowly.

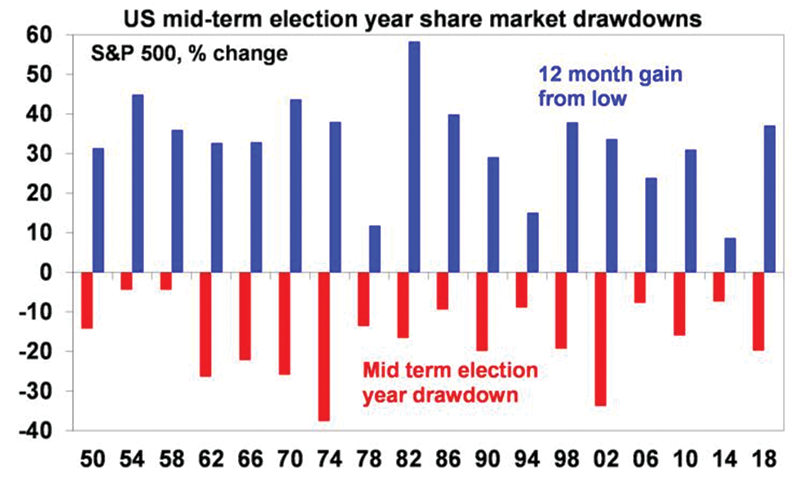
    Will the Australian Federal election have much impact?

    There is a tendency for Australian shares to be somewhat flat in the run up to Federal elections followed by a bounce once it’s over and this is likely to apply this year with the election likely in May. In contrast to the 2019 election where Labor offered a higher tax and higher regulation agenda the policy differences so far appear less significant and if this remains the case the impact on investment markets is likely to be minor.

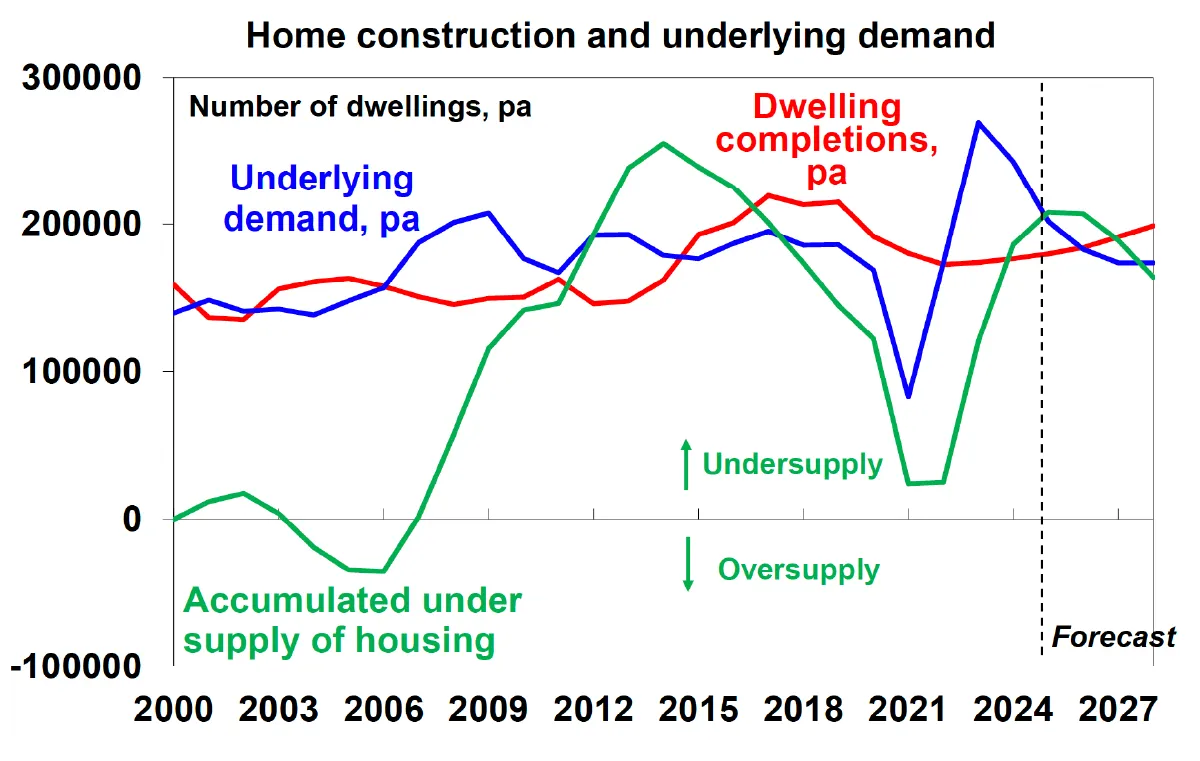
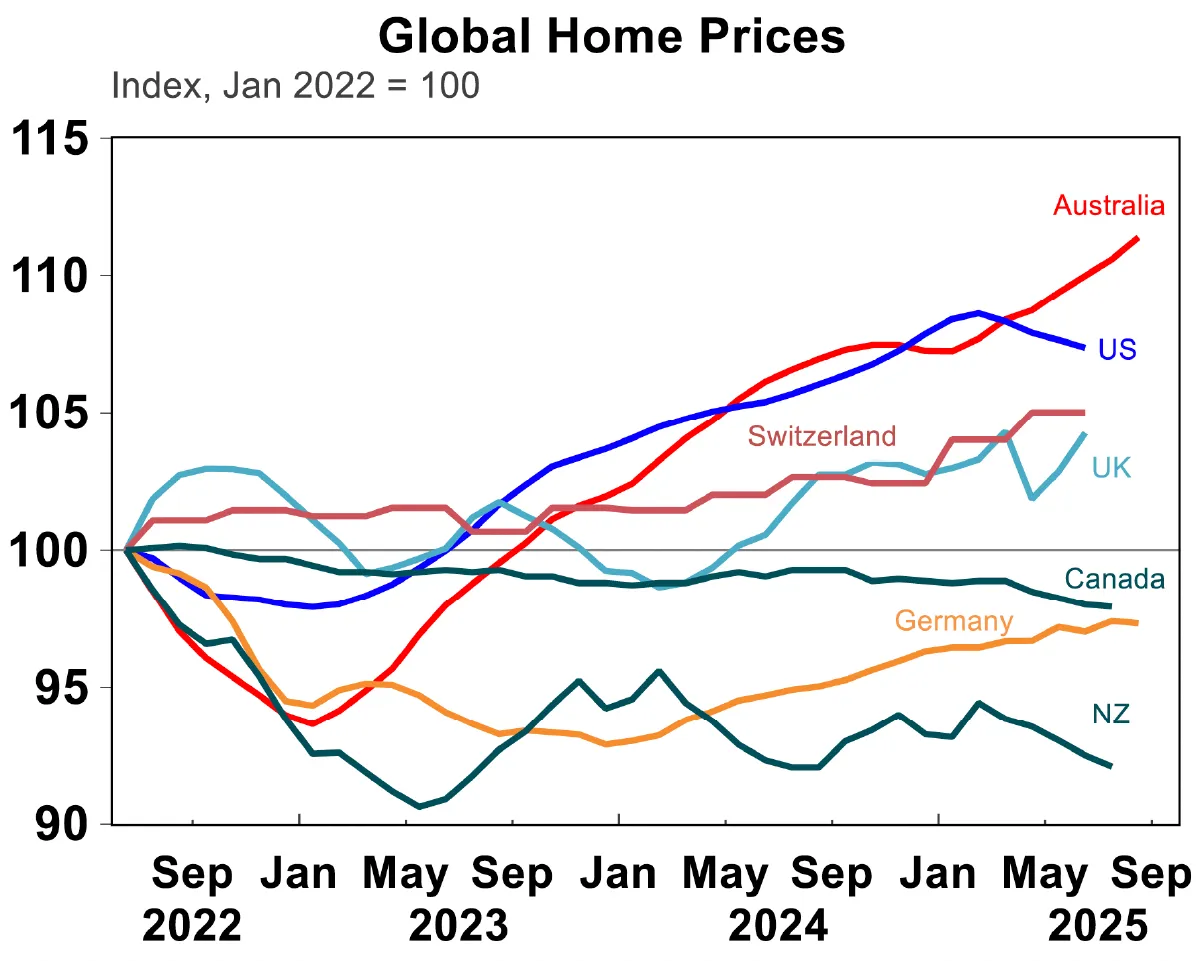
    What is the outlook for Australian home prices?

    From their pandemic lows in 2020 Australian dwelling prices are up 25%, but the gains have been slowing since March last year. We expect a further slowing in the months ahead as a result of worsening affordability, already rising fixed mortgage rates and rising variable rates from around August with average prices peaking in the September quarter and then falling into 2024. While prices are likely to rise 3% this year, they are likely to fall -5-10% next year. Top to bottom the fall could be around -10-15%, which would take prices back to the levels of mid last year. Sydney and Melbourne are the most vulnerable to higher rates as they have worse affordability and higher debt to income levels. They are both likely to see house prices peak by mid-year and risk top to bottom price falls of around 15%, whereas other cities and regions may not peak till later this year and have more modest top to bottom price falls.

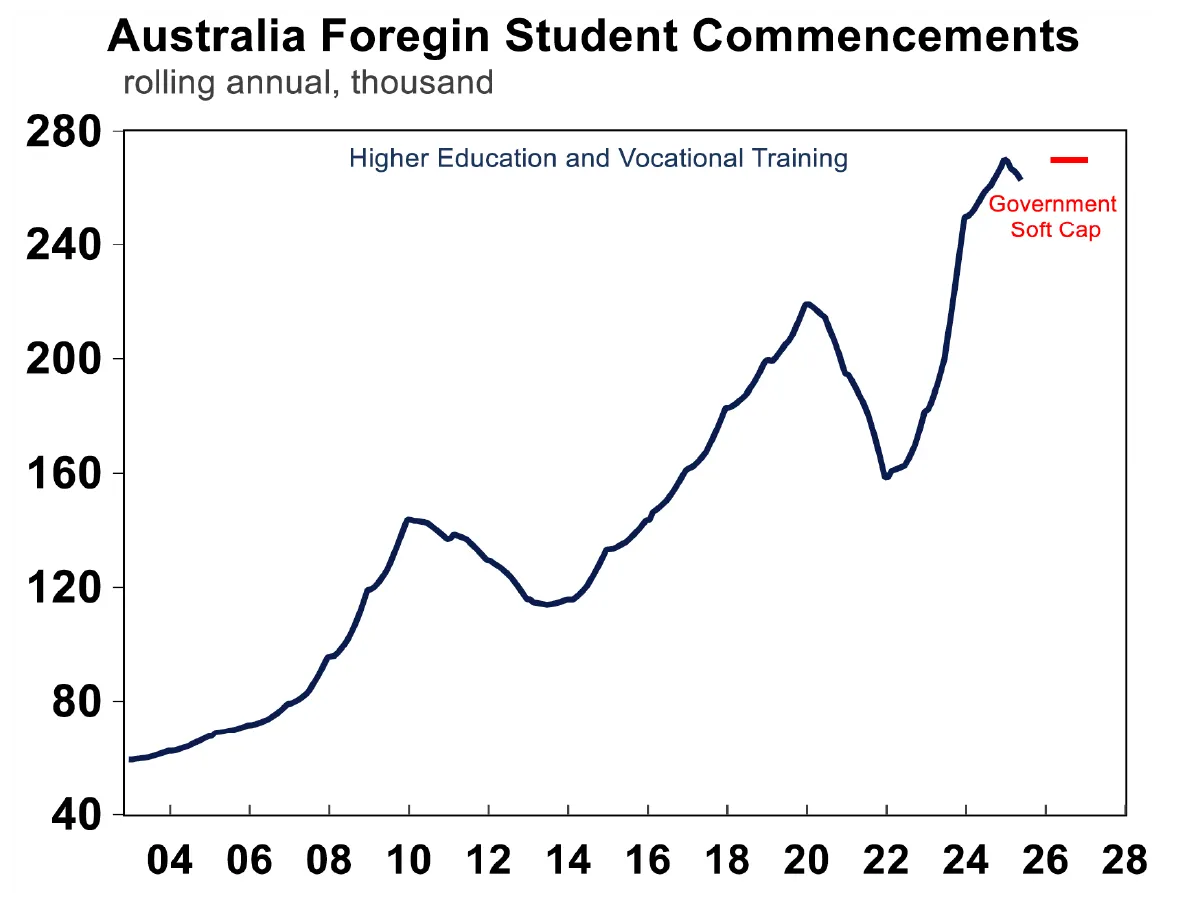
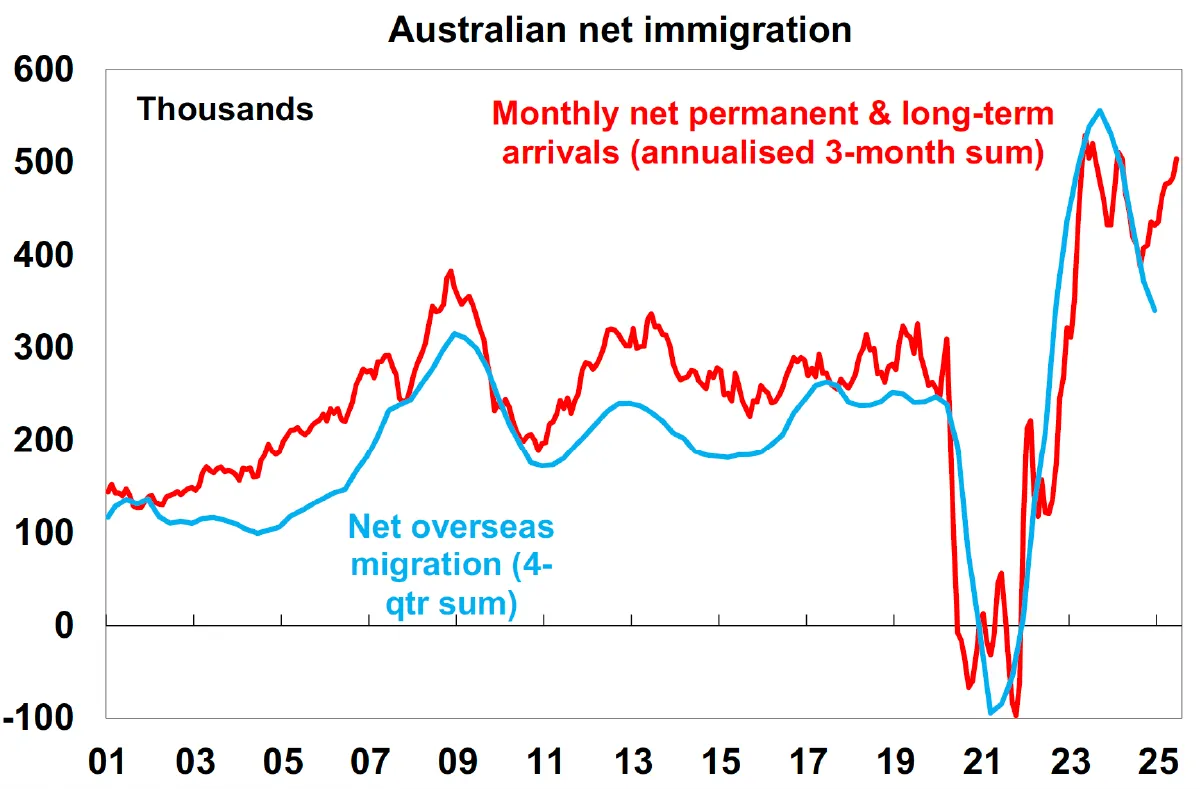
    Will the return of immigrants support home prices?

    The return of immigrants this year will provide some support but will unlikely be enough to stop falls given the dominant impact of higher mortgage rates in constraining demand and given the likelihood that the initial return of immigrants will be gradual and won’t offset the net negative immigration of the last two years.

    How can we improve housing affordability?

    This requires a multifaceted solution across all levels of government with targets to be achieved over say a five-year period. My list of policies to improve affordability includes:

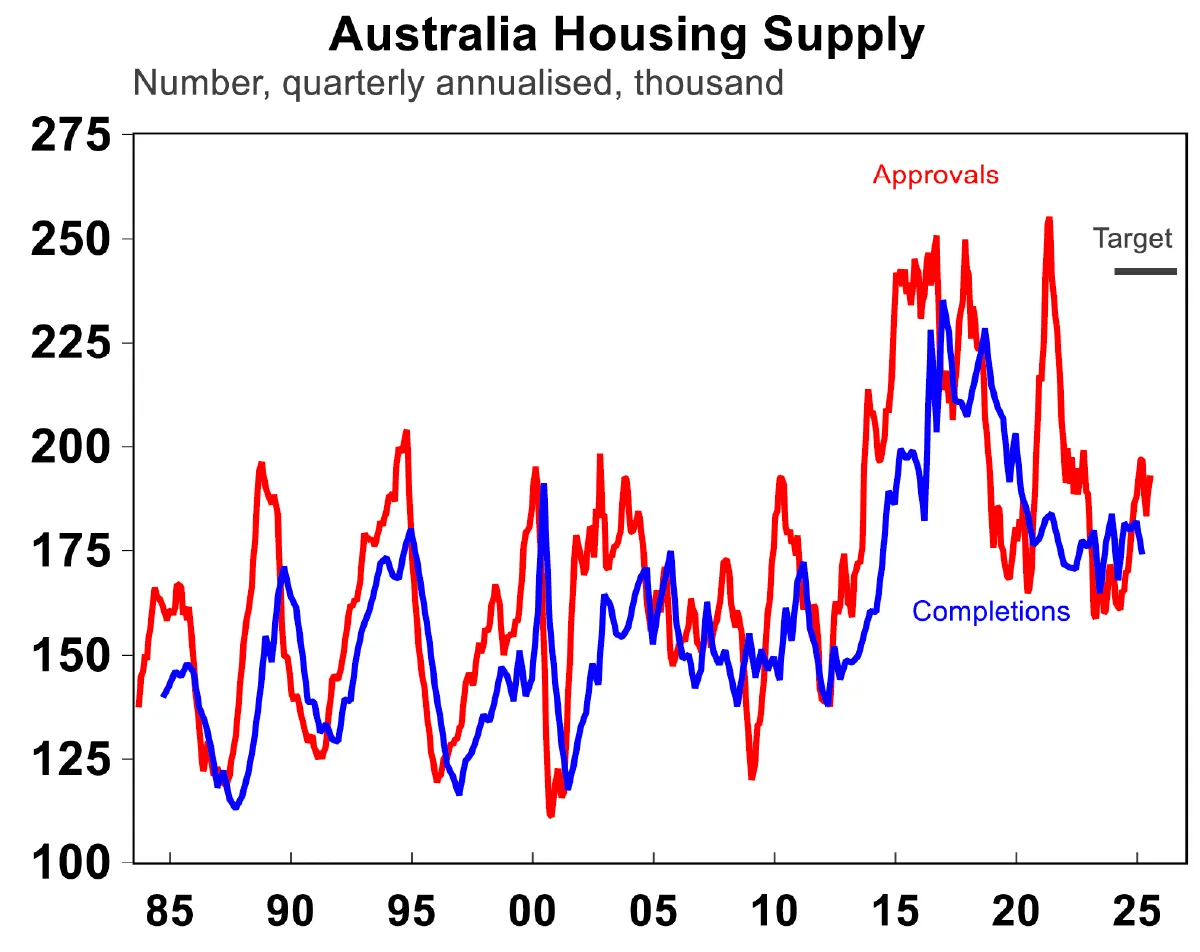
    • Measures to boost new supply – relaxing land use rules, releasing land faster and speeding up approval processes.
    • Matching the level of immigration in a post pandemic world to the ability of the property market to supply housing.
    • Encouraging greater decentralisation – the “work from home” phenomenon shows this is possible, but it should be helped along with appropriate infrastructure and of course measures to boost regional housing supply. Excess CBD office space should be speedily converted to residential.
    • Tax reform to replace stamp duty with land tax (to make it easier for empty nesters to downsize & cutting the upfront burden for first home buyers) & cutting the capital gains tax discount (to end a distortion favouring speculation).

    What is the outlook for commercial property?

    Commercial property may see weakness in retail and office returns as the influence of the pandemic on online buying and working from home impacts as retail and office leases come up for renewal, but industrial property is likely to be strong.

    Should investors invest in Bitcoin and other cryptos?

    It’s hard to see Bitcoin becoming digital cash – its transactions are slow and high cost, its highly volatile and it’s a massive user of electricity. It’s not an asset generating cash flows like rent or dividends which makes it very hard to value. And it appears to move in magnified fashion relative to shares, particularly during share market falls making it a poor portfolio diversifier. All of which makes it hard to justify other than as something to speculate on! Of course, this is not to say it can’t go up further as more jump on the bandwagon. Blockchain and distributed ledger technology offer significant potential but it’s hard to separate this from the speculation around crypto currencies.

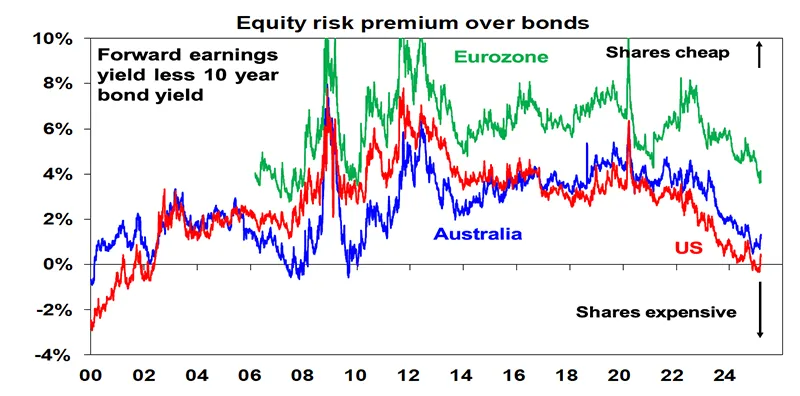
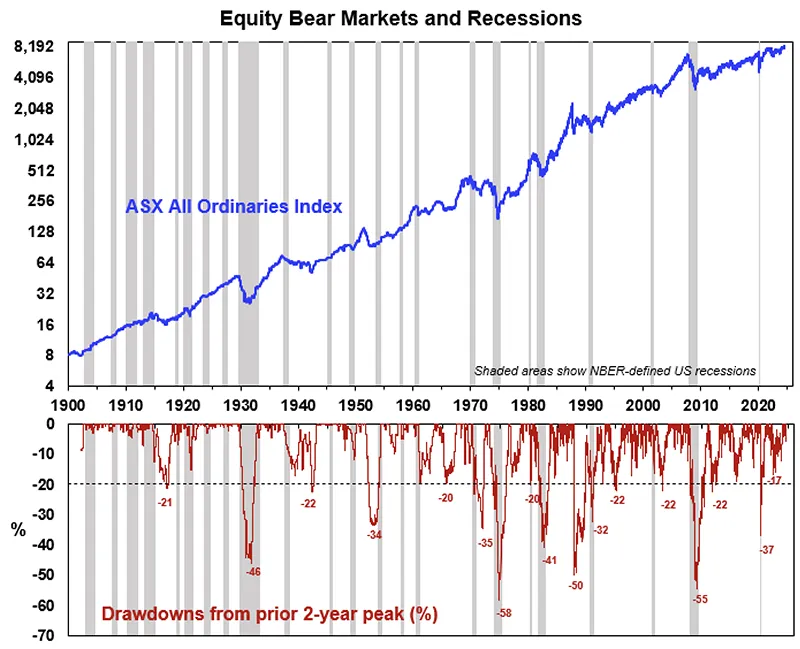
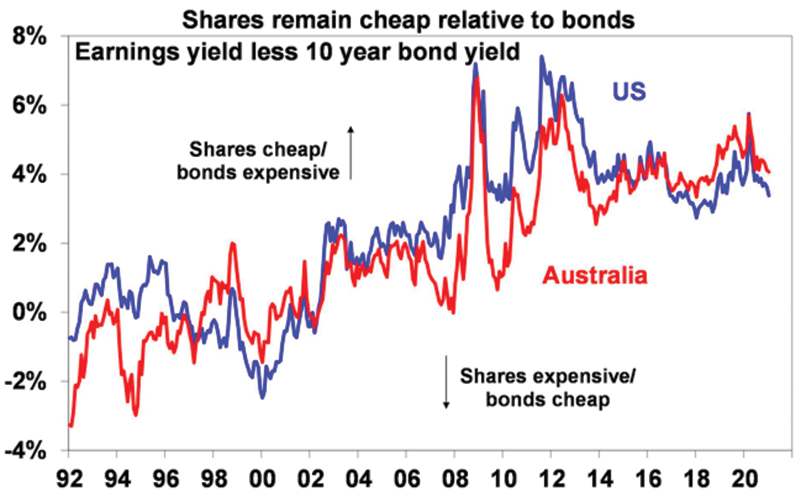
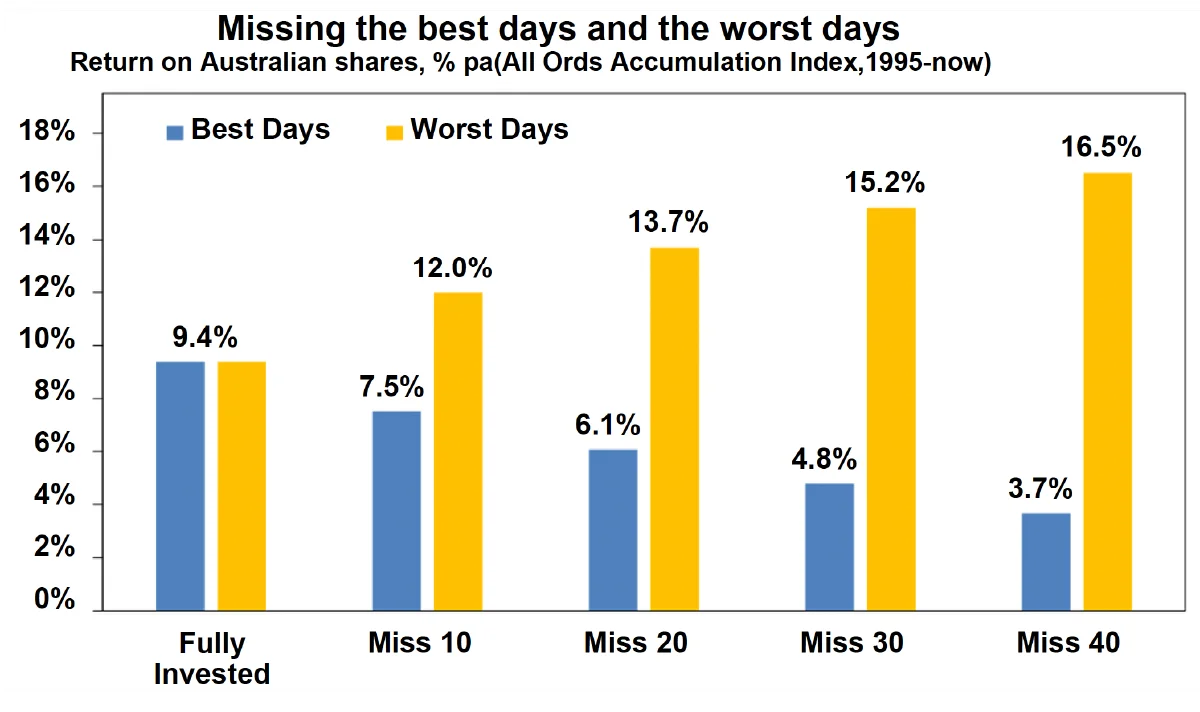
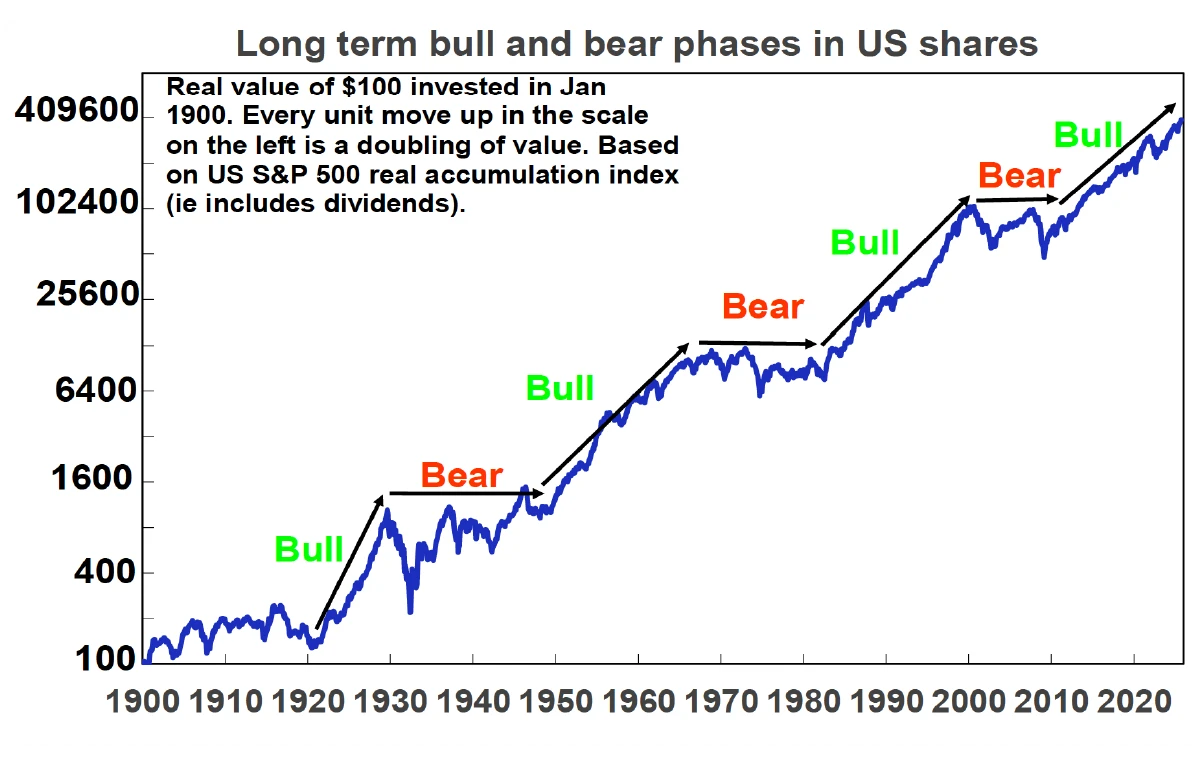
    Will high inflation cause a share market crash?

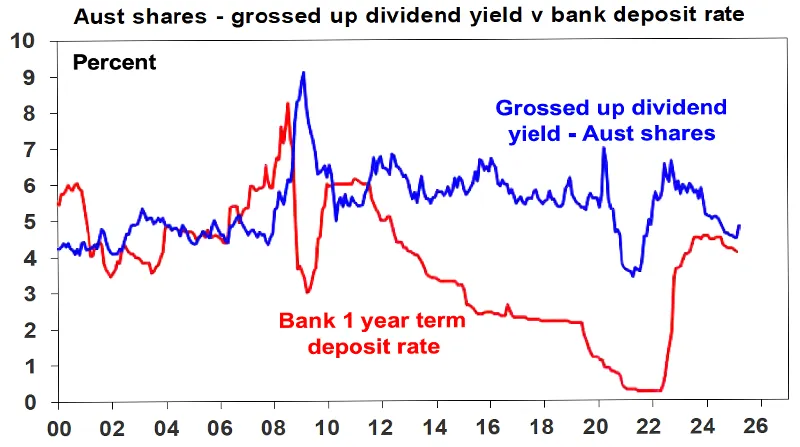
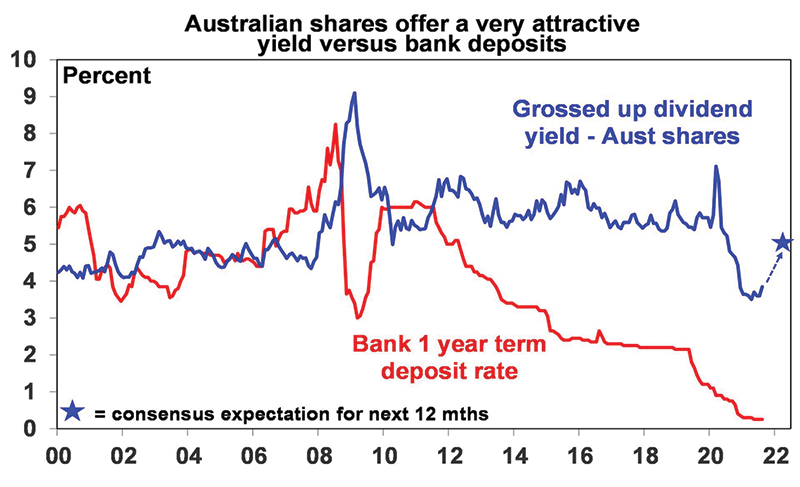
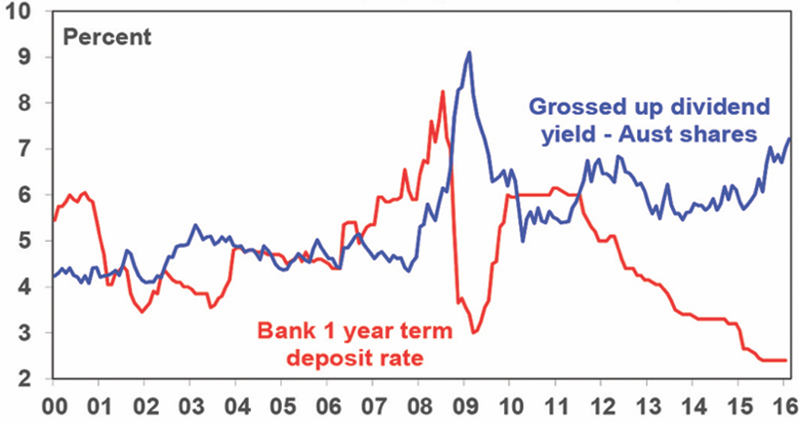
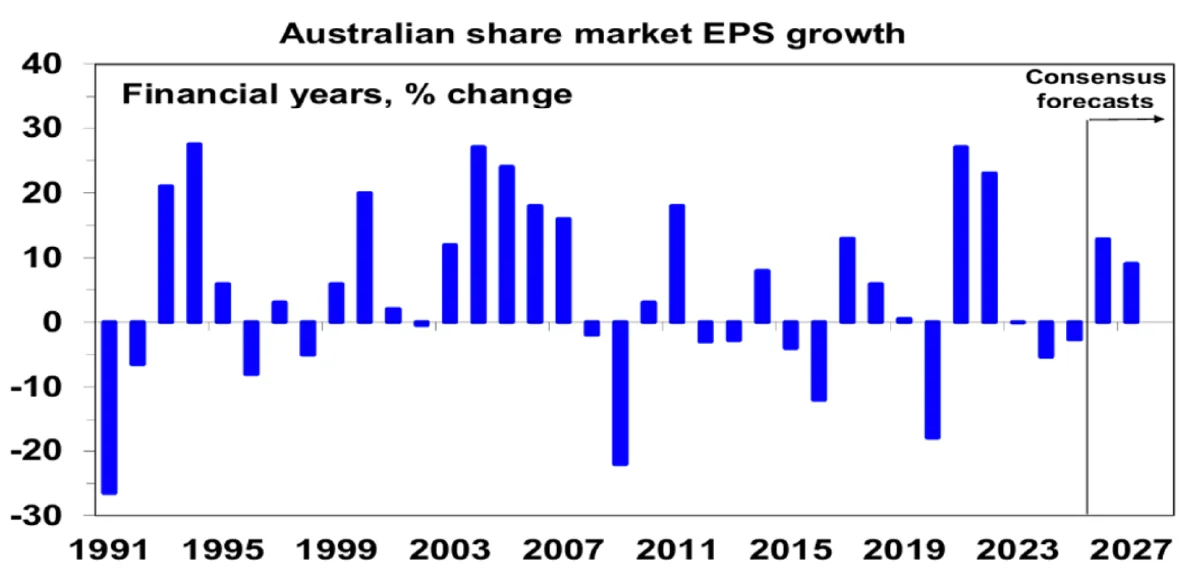
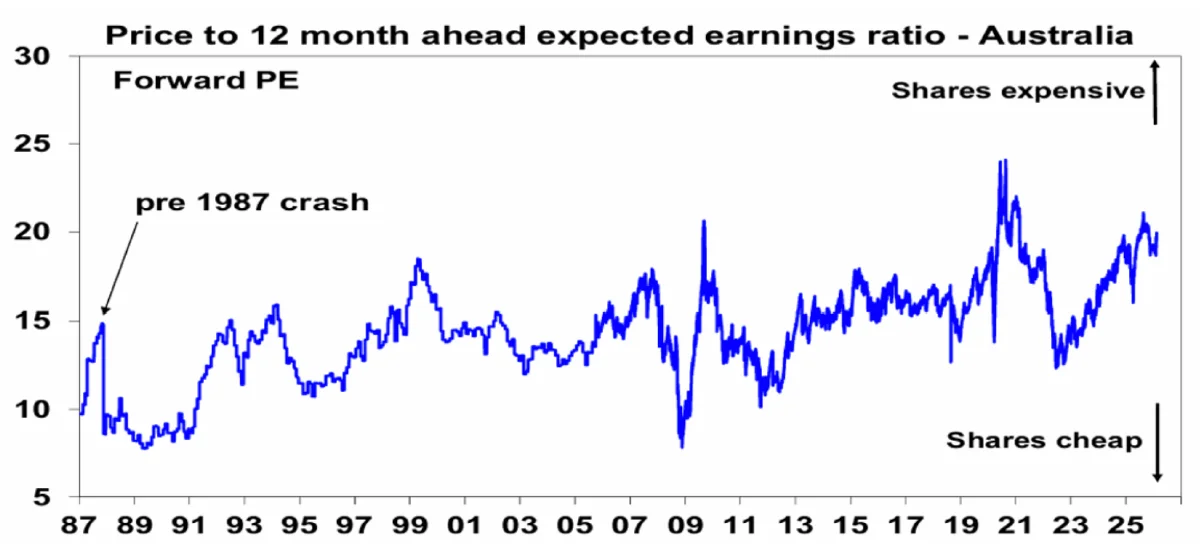
    Shares have had a very strong rebound from their pandemic lows and are vulnerable to higher inflation as it puts upwards pressure on interest rates and downwards pressure on share market valuations (or price to earnings multiples). However, while a crash is always a risk it’s not our base case. First, earnings expectations are still being revised up albeit not as strongly as a year ago. Second, while monetary policy will be tightened its unlikely to become so tight as to cause a recession and slump in earnings. Finally, share markets still offer a strong earnings yield premium relative to bond yields in contrast to in the year 2000 when bond yields rose above earnings yields. Of course, if inflation just continues to surge then the risks to shares will increase.

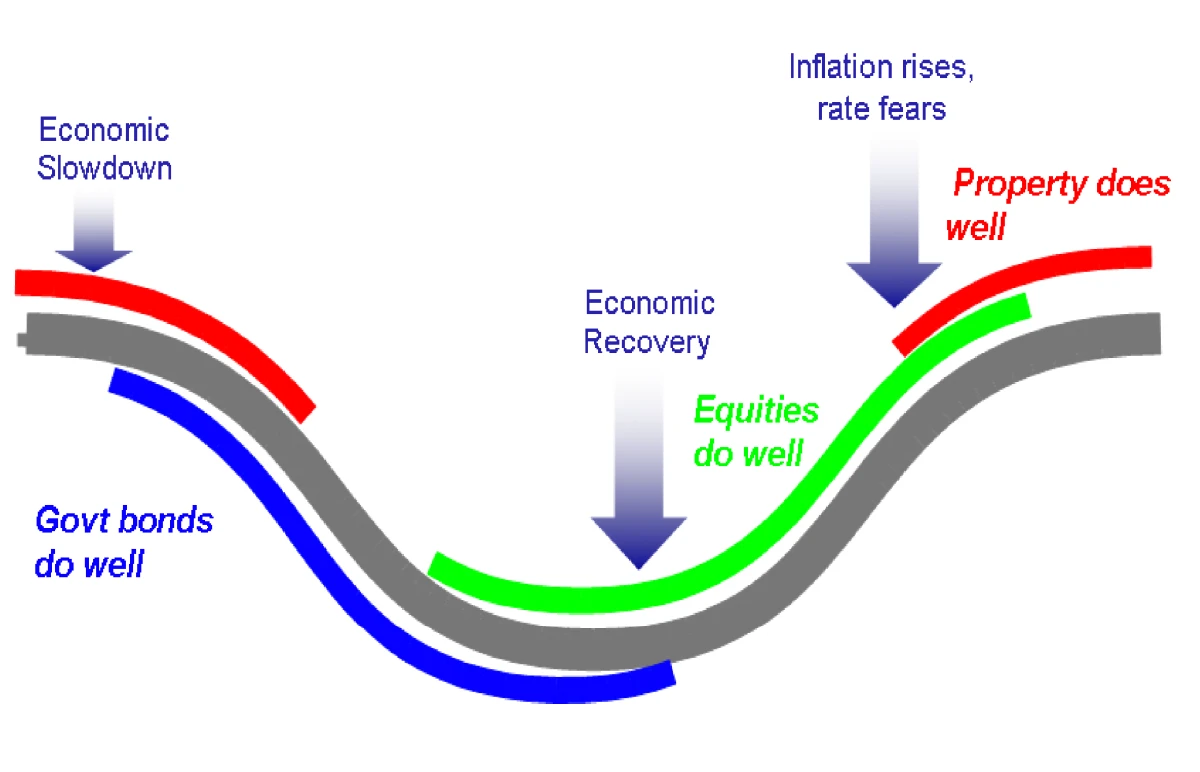
    What are good hedges against higher inflation?

    Sustained higher inflation will ultimately mean upwards pressure on the yield structure in the economy which is negative for investments that have benefitted from years of low and falling interest rates, like high PE tech stocks. The best protection against sustained higher inflation would be inflation linked bonds, real assets like commodities and parts of the share market that will see stronger earnings growth.

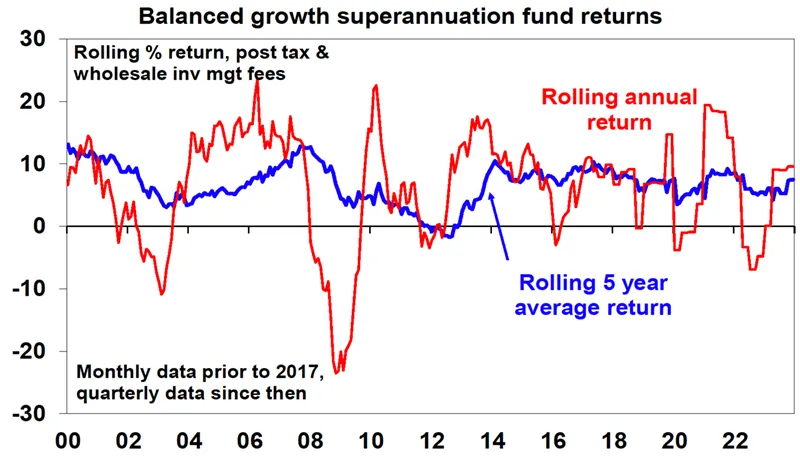
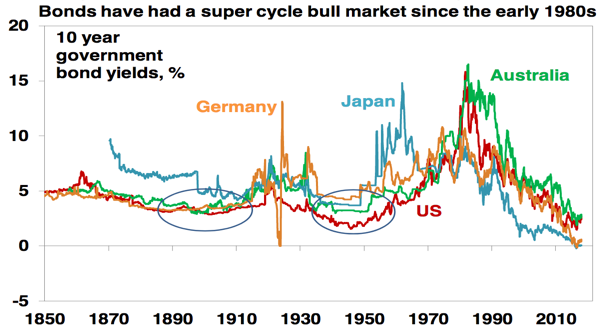
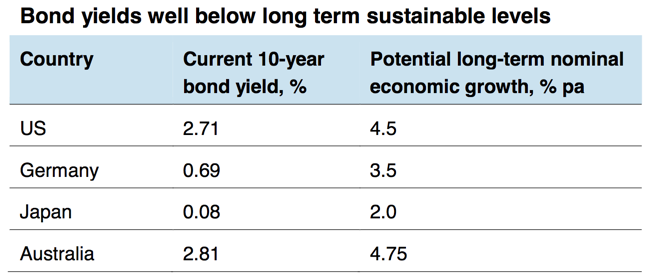
    With bond yields still low why invest in bonds?

    Bonds are likely to see another year of negative returns this year reflecting still low starting point yields and capital losses as yields rise. However, they are still a good portfolio diversifier as they are likely to rally if significant concerns arise about a recession.

    Closing comments

    So, in closing , although we sent an economic update only 4 weeks ago, a lot has happened in the past 4 weeks and potentially a lot more can happen. It’s how we react in these times. Rather than panic, we take advantage of mispriced markets that always recover given some time.

    As I also say, if you’re an advised client, you don’t need to worry. However, if you’re not regularly reviewing your investments and overall strategy with one of our Financial Planners, you need to act swiftly. 

    Stay calm, review if needed and ride this one out with our recommended strategies.


    Bill Bracey – CEO, Managing Director
    Sydney Financial Planning  


    Your long-term strategy and investments positioned for taking take advantage of mispriced markets?

    Speak with one of our Financial Planners about the best approach for your circumstances, either book a meeting or get in contact with us on 02 9328 0876.


    This article was prepared by William Bracey and Dr Shane Oliver. Dr Shane Oliver who provides economic forecasts and analysis of key variables and issues affecting, or likely to affect, all asset markets. He also provides economic forecasts and analysis of key variables and issues affecting, or likely to affect, all asset markets.

    Important note: While every care has been taken in the preparation of this document, AMP Capital Investors Limited (ABN 59 001 777 591, AFSL 232497) and AMP Capital Funds Management Limited (ABN 15 159 557 721, AFSL 426455) make no representations or warranties as to the accuracy or completeness of any statement in it including, without limitation, any forecasts. Past performance is not a reliable indicator of future performance. This document has been prepared for the purpose of providing general information, without taking account of any particular investor’s objectives, financial situation or needs. An investor should, before making any investment decisions, consider the appropriateness of the information in this document, and seek professional advice, having regard to the investor’s objectives, financial situation and needs. This document is solely for the use of the party to whom it is provided.

    General Disclaimer: This article contains information that is general in nature. It does not take into account the objectives, financial situation or needs of any particular person. You need to consider your financial situation and needs before making any decisions based on this information. Please seek personal financial advice prior to acting on this information.

    2022 macro investment outlook

    Macro investment update – January 2022

    2022 macro investment outlook

  • 2022 is likely to see more constrained returns with increased volatility.
  • Watch: coronavirus and vaccines; inflation; the US mid-term elections; China issues; Russian tensions with Ukraine and the west; & the Australian election.
  • Introduction

    Despite a wall of worry with coronavirus and inflation, 2021 was a great year for diversified investors, with average balanced growth super funds looking like they have returned around 14%, after just 3.6% in 2020. Balanced growth super fund returns have averaged around 8.5%pa over the last five years, well above inflation and bank deposit rates.

    But can strong returns continue? Here is a simple point form summary of key insights and views on the investment outlook.

    spf ed24 balanced growth super fund returns 001

    Source: Mercer Investment Consulting, Morningstar, AMP

    Six things that went wrong in 2021

    • Several coronavirus waves disrupted economic activity.
    • Inflation took off as coronavirus boosted spending on goods and disrupted production and supply chains
    • Some key central banks started to remove monetary stimulus earlier than expected with some raising rates.
    • Bond yields surged.
    • Chinese growth slowed sharply.
    • Geopolitical tensions with China, Russia & Iran stayed high.

    But there were three big positives

    • Science and medicine appeared to offer hope of getting on top of coronavirus. This saw less severe illness through the mid-year Delta wave compared to the 2020 waves.
    • As a result, the broad trend was towards global reopening.
    • Monetary and fiscal policy remained ultra-easy.

    As a result, global growth is estimated to have been nearly 6% and this drove strong profit growth and along with low rates saw strong returns from shares and other growth assets offsetting losses in bonds.

    Four lessons from 2021

    • Inflation is not dead – a surge in money supply under the right circumstances, in this case massive fiscal stimulus and supply shortages, can still boost inflation.
    • Shares climb a wall of worry – particularly if earnings are rising and interest rates are low/monetary policy is easy.
    • Timing market moves is hard and the key is to have a well-diversified portfolio – despite lots of worries share markets overall surprised with their strength but some share markets (eg in Asia missed out) and bonds performed poorly.
    • Turn down the noise – investors are getting bombarded with irrelevant, low quality and conflicting information which confuses and adds to uncertainty. So, the best approach is to turn down the noise and stick to a long-term strategy.

    Seven reasons for optimism on economic growth

    • Coronavirus could finally be moving from a pandemic to being endemic – more on this below.
    • Excess savings of around $US2.3trn in the US and $250bn in Australia will provide an ongoing boost to spending.
    • While Fed and likely RBA monetary policy will tighten this year it will still be easy. It’s usually only when policy becomes tight that it ends the economic cycle & the bull market and that’s a fair way off.
    • Inventories are low and will need to be rebuilt which will provide a boost to production.
    • Positive wealth effects from the rise in share and home prices will help boost consumer spending.
    • China is likely to ease policy to boost growth.
    • While business surveys are down from their highs, they remain strong and consistent with good growth.

    Global growth is likely to slow this year but to a still strong 5% with Australian growth of around 4%, despite the Omicron wave resulting in a brief set back in the March quarter. We have revised down our March quarter Australian GDP forecast by 1% to 0.6%, but revised up subsequent quarters by the same.

    Four reasons for optimism regarding coronavirus

    The current situation is quite worrying. Global and Australian coronavirus cases have surged over the last month. Australia managed the first 22 months of the pandemic highly effectively with a suppression strategy that minimised deaths and supported the economy. Following the further relaxation of restrictions since November, significant pressure has been placed on the health system. Overseas experience showed a reopening rebound in Delta cases in even highly vaccinated countries (eg, Singapore). And the Omicron variant arrived in late November with clear evidence it was far more transmissible than Delta. All at a time when much of the population has yet to have a booster shot. The end result looks like being another hit to the economic recovery in the current quarter as people self-regulate to avoid covid or have to isolate. However, each covid wave seems to be having a smaller negative economic impact. More fundamentally, despite the short-term uncertainty there are four reasons for optimism regarding coronavirus:

    • Vaccines are still providing protection against serious illness – particularly once booster shots are administered.
    • New coronavirus treatments are on the way which will aid in the treatment of the more vulnerable.
    • Omicron is more transmissible but less harmful (evident in far lower levels of hospitalisations and deaths relative to the surge in new cases compared to past waves) and so could come to dominate other variants.
    • Past covid exposure is providing a degree of herd immunity.

    Combined, this could set coronavirus on the path to being endemic where we learn to “live” with it. South Africa, London and New York are possibly already seeing signs of a peak in Omicron. Of course, the risk of new variants that are more transmissible & more deadly remains – which is why it’s in the interest of developed countries to speed up global vaccination.

    Key views on markets for 2022

    Still solid economic growth, rising profits and still easy monetary conditions should result in good overall investment returns.

    • Global shares are expected to return around 8% but expect to see a rotation away from growth and tech heavy US shares to more cyclical markets.
    • Australian shares are likely to outperform, helped by leverage to the global cyclical recovery and as investors continue to search for yield in the face of near zero deposit rates but a grossed-up dividend yield of around 5%.
    • Still very low yields & a capital loss from a rise in yields are likely to again result in negative returns from bonds.
    • Unlisted commercial property may see some weakness in retail and office returns, but industrial is likely to be strong. Unlisted infrastructure is expected to see solid returns.
    • Australian home price gains are likely to slow with prices falling later in the year as poor affordability, rising fixed rates, higher interest rate serviceability buffers, reduced home buyer incentives and higher listings impact.
    • Cash and bank deposits are likely to provide very poor returns, given the ultra-low cash rate of just 0.1%.
    • Although the $A could fall further in response to coronavirus and Fed tightening, a rising trend is likely over the next 12 months, helped by still strong commodity prices and a decline in the $US, probably taking it to around $US0.80.

    Five reasons to expect more volatility

    • Inflation – while its likely to moderate this year as production rises & goods demand subsides it is likely to be associated with ongoing scares and the risk that its higher for longer.
    • The start of Fed and RBA rate hikes and quantitative tightening – monetary policy is unlikely to get tight enough to threaten the economic recovery and cyclical bull market, but monetary tightening could still cause volatility.
    • The US mid-term elections – mid-term election years normally see below average returns in US shares, and since 1950 have seen an average drawdown of 17%, albeit with an average 33% gain over the subsequent 12 months.
    spf ed24 us mid term election year share drawdowns 002

    Source: Strategas, AMP

    • China/Russia/Iran tensions – a partial Russian invasion of Ukraine could lead to even higher European gas prices.
    • Mean reversion – shares are no longer cheap, the easy gains are behind us and calm years like 2021 tend to be followed by volatile years.

    Six things to watch

    • Coronavirus – new variants could set back the recovery.
    • Inflation – if it continues to rise and long-term inflation expectations rise, central banks will have to tighten aggressively putting pressure on asset valuations.
    • US politics – political polarisation is likely to return to the fore in the US, posing the risk of a deeper than normal mid-term election year correction in shares.
    • China issues are likely to continue – with the main risks around its property sector and Taiwan.
    • Russia – a Ukraine invasion could add to EU energy issues.
    • The Australian election – but if the policy differences remain minor, a change in government would have little impact.

    Nine things investors should remember

    Yeah – I put these in most years!

    • Make the most of the power of compound interest. Saving regularly in growth assets can grow wealth substantially over long periods. Using the “rule of 72”, it will take 144 years to double an asset’s value if it returns 0.5%pa (ie, 72/0.5) but only 14 years if the asset returns 5%pa.
    • Don’t get thrown off by the cycle. Falls in asset markets can throw investors out of a well thought out strategy.
    • Invest for the long-term. Given the difficulty in timing market moves, for most it’s best to get a long-term plan that suits your wealth, age & risk tolerance & stick to it.
    • Diversify. Don’t put all your eggs in one basket.
    • Turn down the noise.
    • Buy low, sell high. The cheaper you buy an asset, the higher its prospective return will likely be and vice versa.
    • Avoid the crowd at extremes. Don’t get sucked into euphoria or doom and gloom around an asset.
    • Focus on investments you understand offering sustainable cash flow. If it looks dodgy, hard to understand or has to be justified by odd valuations or lots of debt, then stay away.
    • Seek advice. Investing can get complicated and its often hard to stick to a long-term investment strategy on your own

    Closing comments

    We send out economic updates like this one to provide our valued clients with a so much needed perspective. Not to create headlines, not to forecast, but instead, to give you a balanced update of what we’ve been doing behind the scenes. To let you know that we’re monitoring this stuff, so you don’t have to.

    Mainstream and financial services media make it very attractive to capture our eyeballs. They want us to think that whatever the crisis du jour is, it’s something we really need to know. The difference between you and other people around you is that you have a plan in place, and you have someone to talk to. Someone who knows you and your plan and someone who understands what’s important to you and your family. It’s what really matters – knowing if one’s on track with their long-term plan. Everything else is commentary. If you review your progress and strategies with us yearly, you maximise your chances to achieve your desired lifestyle.

    You and I are long-term, goal-focused, plan-driven equity investors. We believe that the key to lifetime success in equity investing is to act continuously on a specific, written plan. Likewise, we believe substandard returns and even investment failure proceeds inevitably from reacting to (let alone trying to anticipate) current economic/market events. We’re convinced that the economy cannot be consistently forecast, nor the markets consistently timed. Therefore, we believe that the only reliable way to capture the full long-term return of equities is to ride out their frequent but historically always temporary declines.

    We look forward to seeing all our clients face to face or via video link depending on what works best at the time. The important thing is when your financial planner says we need to talk, make sure you put time aside as it’s about your future.
    Goodbye and good riddance to 2021, wishing all our clients a healthy and prosperous 2022.


    Bill and the team at SFP.


    What does your long-term strategy and investment opportunity for 2022 look like?

    Speak with one of our Financial Planners about the best approach for your circumstances, either book a meeting or get in contact with us on 02 9328 0876.


    This article was prepared by William Bracey and Dr Shane Oliver. Dr Shane Oliver who provides economic forecasts and analysis of key variables and issues affecting, or likely to affect, all asset markets. He also provides economic forecasts and analysis of key variables and issues affecting, or likely to affect, all asset markets.

    Important note: While every care has been taken in the preparation of this document, AMP Capital Investors Limited (ABN 59 001 777 591, AFSL 232497) and AMP Capital Funds Management Limited (ABN 15 159 557 721, AFSL 426455) make no representations or warranties as to the accuracy or completeness of any statement in it including, without limitation, any forecasts. Past performance is not a reliable indicator of future performance. This document has been prepared for the purpose of providing general information, without taking account of any particular investor’s objectives, financial situation or needs. An investor should, before making any investment decisions, consider the appropriateness of the information in this document, and seek professional advice, having regard to the investor’s objectives, financial situation and needs. This document is solely for the use of the party to whom it is provided.

    General Disclaimer: This article contains information that is general in nature. It does not take into account the objectives, financial situation or needs of any particular person. You need to consider your financial situation and needs before making any decisions based on this information. Please seek personal financial advice prior to acting on this information.

    Correction time? Shares get the wobblies

    Correction time? Shares get the wobblies – seven things investors need to keep in mind.

    Correction time? Shares get the wobblies

  • Shares may still have more downside as it will take a while to resolve some of these issues.
  • Key things for investors to bear in mind are that: corrections are healthy and normal; a renewed recession is unlikely and this will limit share market falls; selling shares after a fall locks in a loss; share pullbacks provide opportunities for investors to buy them more cheaply; shares offer an attractive income flow; and finally, to avoid getting thrown off a long-term investment strategy it’s best to turn down the noise during times like this.
  • Introduction

    The past week has seen share markets wobble – with US shares and global shares down 4% from their recent high and Australian shares falling about 5% – amidst concern about global growth, central banks starting to reduce monetary stimulus and problems at a major Chinese property developer. Some are even talking about a “Lehman moment” in relation to the latter – a reference to the collapse of Lehman Brothers in September 2008 that contributed to the worst of the GFC. Markets have stabilised a bit in the last day or so but its too early to say that we have seen the bottom. This note looks at the key issues for investors and puts the falls into context.

    A long worry list is behind the weakness

    The wobbles in shares reflects a long worry list that has been building for a few months now.

    • Recent economic data globally has been softer than expected, leading to concerns peak growth is behind us.
    • Uncertainty remains over the impact of the Delta variant.
    • Supply side constraints globally appear to be constraining growth and threatening to continue boosting inflation.
    • Central banks are starting to slow monetary stimulus with a focus this week on when the Fed will announce a “tapering”, or slowing, of its bond buying.
    • The US Congress needs to pass a continuing resolution to fund Federal spending by the end of the month (to avoid another Government shutdown) and will need to increase or suspend the debt ceiling sometime between mid-October and mid-November (to avoid the US Government defaulting on its debt servicing and social security commitments).
    • Congress is looking at tax hikes (on corporates which could knock 5% off US earnings, capital gains and dividends) to help fund Biden’s $US3.5trillion remaining stimulus plans.
    • The Chinese economy has been slowing in response to earlier policy tightening and recent coronavirus restrictions, adding to concerns about global growth.
    • Debt servicing problems at China Evergrande Group – China’s second largest property developer has gotten into trouble as a result of high debt levels and property tightening measures. If Evergrande ends in a full-scale default and liquidation of its assets, some worry that this may lead to another “Lehman moment” in terms of a flow on the Chinese financial system and property market, posing a big threat to the Chinese economy, global growth and commodity prices (like iron ore).
    • And share markets having had huge gains since their March lows last year – with US shares doubling having risen 14 of the last 17 months and Australian shares up 68% having risen 16 of the last 17 months – are arguably vulnerable to a bit of a pull back.

    Considerations for investors

    Sharp market falls with talk of “Lehman moments” are stressful for investors as no one likes to see their investments fall in value. However, several things are worth bearing in mind:

    First, while they all have different triggers and unfold differently, periodic corrections in share markets of the order of 5%, 15% and even 20% are healthy and normal. For example, during the tech/dot-com boom from 1995 to early 2000, the US share market had seven pull backs ranging from 6% to 19% with an average decline of 10%.

    During the same period, Australian shares had eight pullbacks ranging from 5% to 16% with an average fall of 8%. All against a backdrop of strong returns every year. During the 2003 to 2007 bull market, the Australian share market had five 5% plus corrections ranging from 7% to 12%, again with strong positive returns every year. And the last decade regularly saw major pullbacks. See the next chart.

    sfp ed23 share market pullback 001

    Source: Bloomberg, AMP Capital

    SFP ed23 september rough month 002

    Source: Bloomberg, AMP Capital

    And right now, we are in the time of year often associated with share market pullbacks. Over the last 35 years, September has been the weakest month of the year for both US and Australian shares. See the next chart. US shares have fallen in five of the last 10 Septembers and the Australian share market has fallen in seven of the last 10, with both falling in September last year.

    But while share market pullbacks can be painful, they are healthy as they help limit complacency and excessive risk taking. Related to this, shares climb a wall of worry over many years with numerous events dragging them down periodically, but with the long-term trend ultimately up & providing higher returns than other more stable assets. Bouts of volatility are the price we pay for the higher longer-term returns from shares.

    SFP ed23 australian shares climb wall 003

    Source: ASX, AMP Capital

    Second, historically the main driver of whether we see a correction (a fall of say 5% to 15%) or even a mild bear market (with say a 20% decline that turns around relatively quickly like we saw in 2015-2016) as opposed to a major bear market (like that seen in the global financial crisis (GFC) or the 35% or so falls seen in February/March last year going into the coronavirus pandemic) is whether we see a recession or not – notably in the US as the US share market tends to lead most major global markets.

    Right now it’s doubtful that the worry list referred to above, while extensive, will be enough to drive a US, global or Australian recession:

    • While global growth is likely to slow in 2022 business surveys remain strong and global growth is still likely to be strong at around 4%.
    • The exit from the coronavirus pandemic is proving longer and messier than expected – but vaccines are helping protect against serious illness with little support for a return to lockdowns in developed countries. In Australia, the delayed but now rapid vaccination program looks on track to allow a gradual reopening as we learn to live with higher levels of coronavirus though next quarter, avoiding recession ahead of much stronger growth next year.
    • Supply side constraints and hence the near-term inflation threat is likely to recede as recovery continues and spending rotates back towards services from goods.
    • While central banks are heading towards the exits from ultra-easy money, it’s likely to be gradual with low interest rates for some time and the sort of tight monetary policy that brings an end to cyclical bull markets looks a long way off.
    • The path to pass a funding resolution and resolve the debt ceiling in the US looks likely to be a white-knuckle ride with lots of brinkmanship, but neither side wants to be blamed for shutting the government or causing a default so a last minute deal remains likely.
    • Confirmation of rising taxes in the US will be a negative for shares – but tax hikes are likely to be watered down from already watered-down plans such that it’s only a partial reversal of the Trump tax cuts and the direct drag on US profits will only be about 5%.
    • While there is much uncertainty about how Evergrande will be resolved – which could cause more short-term weakness in share markets and the iron ore price – it’s not as systemically important to the Chinese/global financial system as Lehman Brothers was. While the Chinese authorities want to teach property developers and investors a lesson about the dangers of too much debt, it’s unlikely to allow Evergrande’s failure to mushroom into a full-on credit squeeze or a “Lehman moment” that collapses the property sector (via forced property sales) and the economy. So ultimately, some sort of debt restructuring rather than full bankruptcy is likely, with reports of a deal with bond holders regarding a payment due on 23rd September and the relative calm in China’s own debt markets possibly being a sign of that. And more broadly China is likely to provide policy stimulus to support growth into year end.

    Third, selling shares or switching to a more conservative investment strategy whenever shares suffer a setback just turns a paper loss into a real loss with no hope of recovering. And trying to time a market recovery is very hard. The best way to guard against deciding to sell on the basis of emotion after weakness in markets is to adopt a well thought out, long-term strategy and stick to it.

    Fourth, when shares and growth assets fall, they’re cheaper and offer higher long-term return prospects. So, the key is to look for opportunities’ pullbacks provide. It’s impossible to time the bottom but one way to do it is to average in over time.

    Fifth, Australian shares are offering a very attractive dividend yield compared to banks deposits. While resource stocks dividend payments may have peaked for a while following the plunge in iron ore prices, they’re unlikely to fall back much as they didn’t go up as much as earnings and high prices for gas, coal and metals are providing some offset. So, the income flow you are receiving from a well-diversified portfolio of shares is likely to remain attractive, particularly against bank deposits.

    SFP ed23 australian shares attractive yeild 004

    Source: RBA, Bloomberg, AMP Capital

    Sixth, shares and other related assets often bottom at the point of maximum bearishness, ie, just when you and everyone else feel most negative towards them. So, the trick is to buck the crowd. “Be fearful when others are greedy. Be greedy when others are fearful,” as Warren Buffett has said.

    Closing comments

    Finally, turn down the noise. In times of uncertainty, negative news can reach fever pitch. But it often provides no perspective and only adds to the sense of panic. All of this makes it harder to stick to an appropriate long-term strategy let alone see the opportunities that are thrown up. So as always, it’s best to turn down the noise.

    Bill and the team at SFP.


    How is your long-term strategy and investment opportunity looking?

    Speak with one of our Financial Planners about the best approach for your circumstances, either book a meeting or get in contact with us on 02 9328 0876.


    This article was prepared by William Bracey and Dr Shane Oliver. Dr Shane Oliver who provides economic forecasts and analysis of key variables and issues affecting, or likely to affect, all asset markets. He also provides economic forecasts and analysis of key variables and issues affecting, or likely to affect, all asset markets.

    Important note: While every care has been taken in the preparation of this document, AMP Capital Investors Limited (ABN 59 001 777 591, AFSL 232497) and AMP Capital Funds Management Limited (ABN 15 159 557 721, AFSL 426455) make no representations or warranties as to the accuracy or completeness of any statement in it including, without limitation, any forecasts. Past performance is not a reliable indicator of future performance. This document has been prepared for the purpose of providing general information, without taking account of any particular investor’s objectives, financial situation or needs. An investor should, before making any investment decisions, consider the appropriateness of the information in this document, and seek professional advice, having regard to the investor’s objectives, financial situation and needs. This document is solely for the use of the party to whom it is provided.

    General Disclaimer: This article contains information that is general in nature. It does not take into account the objectives, financial situation or needs of any particular person. You need to consider your financial situation and needs before making any decisions based on this information. Please seek personal financial advice prior to acting on this information.

    April 2021 Market Update

    SFP market update and commentary – April 2021 – your questions answered

    April 2021 Market Update

    The global rebound was led by China but looks like being led by the US this year reflecting rapid vaccine dissemination and massive fiscal stimulus. Expect stronger growth in Europe and Japan in the second half as vaccine dissemination there speeds up.

    Are vaccines working? What about new variants?

    Yes. There are now five western vaccines along with vaccines from Russia and China. The evidence from numerous trials and results from Israel (where 58% of the population have received at least one dose) and the UK (where 45% have received at least one dose) indicate that the various vaccines are around 75% plus effective in heading off infection and 100% or near effective in preventing serious illness, hospitalisation or death (including for new variants).

    This is evident in a sharp fall in new cases, hospitalisation and deaths in Israel, the UK and US (where “only” 29% have received at least one dose but about 3 million people a day are now being vaccinated).

    Diagram Covid Vacine impact

    Source: ourworldindata.org; AMP Capital

    Protection against hospitalisation and deaths though is key in providing confidence in a sustained reopening. There may still be occasional new waves of cases until herd immunity is reached and uncertainty remains around how long vaccines last, and this may require top ups. Europe has seen a resurgence in new cases but is lagging in vaccination (10% having received one dose) as are emerging countries and Australia. Vaccine production is ramping up rapidly though so most developed countries will approach some degree of herd immunity (70% plus vaccination) in the second half (mid-year in the US) and emerging countries through next year.

    Will the ending of JobKeeper derail the Australian recovery?

    This is doubtful. The best guide to those vulnerable to job loss from JobKeeper’s end is those working zero hours and this was only running around 70,000 above normal in February which is down from 720,000 in April last year – the loss of 70,000 jobs would push unemployment up but only by around 0.5% and from a much lower than expected level of 5.8% in February and don’t forget that nearly 90,000 jobs were created in February; another 100,000 above normal were working reduced hours but they are more likely to see a reduction in income rather than job loss; various measures of job vacancies are running around 15% above year ago levels suggesting that job losses in travel and CBD-related service businesses should be made up elsewhere; JobKeeper’s injection into the economy has already dropped from $12bn a month last September to $2.5bn a month in March and yet the economy has continued to recover; and its removal will be partly offset by other forms of stimulus such as personal tax cuts and investment incentives. We expect the Australian economy to grow by around 5% this year.

    What about the ongoing snap lockdowns in Australia?

    These are disruptive and a huge barrier to making domestic travel plans, but providing they remain short, the overall economic impact will be minor (as they have been lately). Faster vaccine rollout (with CSL production kicking in) should end them later this year once herd immunity is reached. Of course, if the Brisbane’s snap lockdown (or any other) turns out to be long then the Government may have to consider reinstating JobKeeper or something similar for areas affected.
    The new travel bubble is another sign of recovery and a positive outlook.

    Is inflation going to become a problem?

    Annual inflation is likely to rise towards 4% in both the US and Australia in the months ahead as last year’s price falls drop out, higher commodity prices along with goods supply bottlenecks impact and flood driven rises in fresh fruit and vegetable prices in Australia impact. However, this is likely to be temporary as distortions drop out, goods supply picks up & demand swings back towards services and as wages growth likely remains low.

    Beyond the next 2 to 3 years though the risks on inflation are likely to swing to the upside as spare capacity is used up and ultra-aggressive monetary policy ultimately pushes up inflation at a time when the disinflationary impact of globalisation is starting to fade, and governments are becoming more interventionist in their economies. In other words, we appear to be at a similar juncture to the peak in inflationary pressures seen in the early 1990s – but in reverse.

    What is the best protection against higher inflation?

    Sustained higher inflation will ultimately mean upwards pressure on the yield structure in the economy which could be negative for investments that have benefitted from years of low and falling interest rates like high PE tech stocks. Share market is generally the best protection against sustained higher inflation as it provides higher than inflation total returns. In the next couple of years we also expect inflation linked bonds and real assets like commodities and infrastructure to provide quality yields.

    When will interest rates start to rise?

    Both the Fed and RBA are signalling no rate hikes until 2024 at the earliest as they see it taking this long before labour markets are tight enough to sustain inflation at or just above target. We think it could come a bit earlier in 2023 but that’s still a long way off. Europe and Japan are even further away from raising rates.

    Note though that fixed mortgage rates take their que from long term bond yields and so have already started to bottom out.

    Will massive levels of public debt cause a problem?

    This could become an issue, but a major crisis should be avoided.

    First, public sector borrowing costs are still ultra-low.

    Second, Japan has had high public debt for years without a major problem.

    Third, it’s conceivable that if a problem did arise, governments could cancel the bonds that their central banks now own. Finally, in Australia public debt is relatively low.

    What is the risk of next share market ‘crash’?

    Shares have had a strong rebound from their pandemic lows a year ago and are always vulnerable to a decent correction, this could be triggered by an ongoing sharp rise in bond yields or new coronavirus waves ahead of heard immunity. While a correction is always a risk, as you (hopefully) know, it’s not something to fear.

    First, it’s normal for share market returns to slow in the second 12 months after a bear market low as markets are no longer cheap and they become dependent on higher earnings.

    Second, while the rise in bond yields this year has been sharp it reflects the bond market playing catch up to the economic recovery that share markets started to anticipate last year.

    Third, share market offers strong earnings yield premium relative to bond yields in contrast to in the year 2000 when bond yields rose were above earnings yields. So, shares are not overvalued. Fourth, earnings expectations have been revised up sharply so far this year on the back of the improving growth outlook. Fifth, we are still not seeing the sort of economic overheating, monetary tightening and investor euphoria seen at major market tops. Finally, in relation to the US share market being at a record high – markets are often at all-time highs as shares rise over time.

    Will the $A resume its upswing?

    After briefly hitting $US0.80, the rise in the $A has stalled as the $US rebounded. But with non-US growth likely to accelerate with vaccine deployment, Chinese growth likely to remain strong and some US stimulus leaking globally commodity prices are likely to be strong and safe haven demand for the $US will continue to fall so the upswing in the $A is likely to resume, seeing it end the year above $US0.80.

    Should investors invest in Bitcoin?

    It’s hard to see Bitcoin becoming digital cash – its transactions are slow and high cost, its highly volatile and it’s a massive user of electricity – and it’s not an asset generating cashflows – it doesn’t produce anything and it doesn’t pay any income while you hold it. This means the only way to benefit from bitcoin is to sell it for profit. Once you sell it, you need to think about what you buy with it. All of which makes it hard to justify other than as something to speculate on! Of course, this is not to say that it can’t go up a lot further (or down) as more jump on (or off) its bandwagon.

    Should investors invest in Bitcoin?

    How big a threat are tensions with China?

    For now, the impact on the Australian economy (as opposed to individual sectors) by the tensions with China has been muted by strong commodity prices, the ability to redirect some exports to other markets and China’s practical short-term difficulties in replacing Australian iron ore (there is basically not enough other supply sources). But it’s an issue to keep an eye on.

    Why is there another boom in Australian house prices?

    Australian house price boom

    Economic recovery, the strengthening jobs market, ultra-low interest rates, buyer incentives and FOMO are driving a new boom in property prices. Home prices in March look to have seen their fastest gain since the 1980s. With ultra-low mortgage rates this could run for another 18 months with prices rising by a further 20% or so.

    Several things are likely to eventually slow it down though, particularly from the second half:

    • Government housing incentives are likely to be curtailed;
      • the RBA and APRA are expected to reach yet again for macro prudential controls to slow housing lending. While they don’t target house prices, past experience indicates that surging house prices leads to a deterioration in lending standards and increasing financial stability risks, so it makes sense to start taping the lending standards’ brake soon. First thing to do would be to increase interest rate buffers
      • the recovery in immigration once international borders are reopened is likely to be gradual, resulting in an underlying oversupply of dwellings;
    • it’s likely that the 30-year tailwind for the property market of falling interest rates has now run its course and longer dated fixed rates are starting to rise; and
    • poor affordability is starting to become a constraint again.

    Closing comments

    There is a lot to digest here but if you think about where we were this time last year, a lot of these headlines are what we were hoping for back then. Having faith in the future is crucial in investing and this recovery was a good example of what happens when we stick to our plans and we don’t abandon this important investment principle. Big congratulations to all our clients who listened to our guidance and rode out another bear market via disciplined dollar cost averaging. You and your families have benefited from the correction’s discounted prices, not because we’re smarter, not because we have better investment skills, but because of the faith in the future.

    The value of the advice you have received is paying off, please make sure you respond to our annual progress review calls, as this is where we will address your individual situation and plan and help you navigate the times ahead.

    Bill and the team at SFP.


    Is your investment strategies for your 2021 portfolio in need of review?

    Speak with one of our Financial Planners to help you navigate the best approach for you, either book a meeting or get in contact with us on 02 9328 0876.


    This article was prepared by William Bracey and Dr Shane Oliver. Dr Shane Oliver who provides economic forecasts and analysis of key variables and issues affecting, or likely to affect, all asset markets. He also provides economic forecasts and analysis of key variables and issues affecting, or likely to affect, all asset markets.

    Important note: While every care has been taken in the preparation of this document, AMP Capital Investors Limited (ABN 59 001 777 591, AFSL 232497) and AMP Capital Funds Management Limited (ABN 15 159 557 721, AFSL 426455) make no representations or warranties as to the accuracy or completeness of any statement in it including, without limitation, any forecasts. Past performance is not a reliable indicator of future performance. This document has been prepared for the purpose of providing general information, without taking account of any particular investor’s objectives, financial situation or needs. An investor should, before making any investment decisions, consider the appropriateness of the information in this document, and seek professional advice, having regard to the investor’s objectives, financial situation and needs. This document is solely for the use of the party to whom it is provided.

    General Disclaimer: This article contains information that is general in nature. It does not take into account the objectives, financial situation or needs of any particular person. You need to consider your financial situation and needs before making any decisions based on this information. Please seek personal financial advice prior to acting on this information.

    7 key charts for investors to watch in 2021

    Seven key charts for investors to watch regarding the global economy and investment markets this year

    7 key charts for investors to watch in 2021

  • Seven key global charts worth keeping an eye on by investors this year are: the trend in new coronavirus cases and deaths; global business conditions PMIs; unemployment; global inflation; bond yields; the gap between earnings yields and bond yields; and the US dollar.
  • Introduction

    Our high-level investment view is that while shares are vulnerable to a short term correction having run up hard since early November, overall investment returns will be solid this year on the back of economic recovery (driven by stimulus and the deployment of vaccines allowing a more sustained reopening) at the same time that interest rates remain low. And we are likely to see a further shift in relative returns to investments that benefit from recovery – resources, industrials, tourism stocks and financials. This note looks at seven charts we see as critical to the outlook.

    Chart #1 – new coronavirus cases

    The deployment of vaccines holds hope for a sustained global reopening and return to something more normal and our base case is that this will be successful over the next year or so. Key to watch will be the trend in new coronavirus cases and deaths.

    global covid cases and deaths

    Source: ourworldindata.org, AMP Capital

    Global new cases have slowed again lately but this appears to owe more to the latest round of lockdowns as only around 5% of developed countries’ populations and less in emerging countries have been vaccinated. Uncertainty remains around vaccine effectiveness in preventing infection and serious illness, their effectiveness against new mutations, how long protection lasts for, what portion of the population will need exposure or vaccination for herd immunity, etc. That said, there are some positive signs regarding vaccine efficacy beyond formal trials out of Israel where vaccination is above 30%.

    Chart # 2 – global business conditions PMIs

    global composite pmi vs global gdp

    Source: Bloomberg, AMP Capital

    Global Purchasing Managers Indexes (PMIs) – surveys of purchasing managers at businesses in most major countries – are an excellent and timely guide to the state of the global economy. Since the initial lockdown lows early last year they have rebounded sharply, albeit with the services sector still lagging given distancing restrictions and remain consistent with strong growth this year. They will ideally need to improve further to see our expectation for global growth of over 5% this year and to underpin a strong rebound in profits.

    Chart 3 – unemployment and underemployment

    At present, investors face the ideal backdrop of improving growth but low interest rates. Key to watch in terms of the latter is spare capacity. One of the best measures of this is unemployment and underemployment

    labour underutilisation rate

    Source: Bloomberg, AMP Capital

    The combination of unemployment and underemployment has fallen sharply from last year’s highs but remains relatively high in the US and Australia. A continuing sharp fall from here would bring forward the time when central banks move from easing to being primed for tightening. That said we have a long way to go to full employment as even pre-coronavirus levels did not generate much inflationary pressure.

    Chart 4 – global inflation

    core inflation

    Source: Bloomberg, AMP Capital

    This year has started with a bit of an inflation scare and US and Australian headline CPI inflation measures look like rising to around 3.5-4% over the year to the June quarter as last year’s June quarter price slump drops out of annual calculations and higher commodity prices feed through. Core and underlying inflation measures will remain the main focus of central banks and right now they are well below target in the US, Europe, Japan and China as is the RBA’s preferred measure of underlying inflation in Australia at 1.2% year on year.

    Chart 5 – bond yields

    Long term bond yields plunged in the initial stages of the pandemic on safe haven demand and then as central banks bought bonds to inject cash into their economies. Higher long bond yields and steeper yield curves (i.e. the gap between long term yields and short-term interest rates) are part and parcel of economic recovery as a result of less saving and more borrowing.

    If we don’t see higher bond yields it would raise concerns that risk taking and investment – or borrowing short and lending long – may not occur. That said, we don’t want bond yields to rise too far too fast lest they boost borrowing costs too quickly and so crimp the recovery and put pressure on share market valuations – as occurred in 1994. So far so good with bond yields up from last year’s lows (by around 0.5% in the US and Australia and less elsewhere) but not dramatically so. More upside in yields is likely this year but too rapid a rise – perhaps as investors who are loaded up on bonds seek to offload them – would be a concern.

    us and au 10 year bond yields

    Source: NBER, Bloomberg, AMP Capital

    Chart 6 – the gap between earnings and bond yields

    The rebound in shares since March has pushed traditional valuations like price to earnings multiples to extremes leading some to fret about overvaluation and a bubble. But shares should trade on higher PEs and hence lower earnings yields when interest rates and bond yields fall. Once this is allowed for, share valuations are not extreme.

    shares remain cheap relative to bonds

    Source: Thomson Reuters, AMP Capitall

    One way to look at this is to compare the earnings yield on shares (i.e. the inverse of the PE) to the 10-year bond yield. Despite the rally in shares and recent rise in bond yields, it indicates that shares still provide a decent risk premium over bonds. This gap is worth watching – rising bond yields would make shares less attractive, but this can be offset by rising company profits where we expect to see strong gains this year.

    Chart 7 – the US dollar

    The US dollar is a counter cyclical currency so cyclical moves in it against a range of currencies are of global significance and bear close watching. Because of the relatively low exposure of the US economy to cyclical sectors like manufacturing and materials, the $US tends to be a “risk-of” currency, i.e. it goes up when there are worries about global growth and down when the outlook brightens. And a lot of global debt is denominated in US dollars particularly in emerging countries, so when the $US goes up it makes it tough for emerging countries.

    If we are right though and the global economy continues to recover, then the $US is likely to decline further (i.e. the red line in the next chart will fall further) which would be positive for emerging countries. It would also mean more upside for the $A against the $US (i.e. the blue line will continue to trend up) – the big movements in which are primarily a $US story. 

    us vs major currencies and australia

    Source: Bloomberg, AMP Capital

    Concluding Comments

    Well, we survived 2020, what a wide year ending in a huge recovery, as dramatic as the correction which caused it. Thanks again to all our well-advised clients, who heeded our advice to ride the correction out.

    Our January 2021 SFP Insight, gives you a snap shot of where we think the world and the world markets are and what to watch out for 2021, as market indicators.

    The US elections over now, so we are all getting back to work and hopefully getting ‘the jab’ soon.
    The sooner it happens, the sooner the economy will recover. In 2021 we expect to see a lot of volatility. Governments and households have gorged on cheap debt, which inflates shares and property markets. Every concerning news will also scare the markets as nations and households hold more debt. As that continues, a lot of incidental investors will sell hard assets fast causing compounding effect of the market volatility.

    After saying that, as interest rates will remain low for a while, governments worldwide wanting to stimulate economies, what better place to invest other than shares and property. So, in short, we see a continued rush to buy these assets as interest rates remain so low and inflation starting to come back.

    You can only take advantage of investment opportunities and purchase discounted assets if you have surplus cashflow and cash reserves. Reinvestment plans benefit from dollar cost averaging in volatile markets. Planning for opportunities and guiding our clients in the changing landscape is what we specialise in. This is a cycle that has been going on for hundreds of years, our job is to help our clients navigate this maze and build wealth.

    Hang onto your hats as we enter the new year, already full of unexpected ups and downs. No matter what happens in the markets, by the end of 2021 well advised clients will have built considerably more wealth.  

    Best wishes for 2021, we look forward to advising you in exciting times.


    Bill and the team at SFP.


    Need some help working the best investment strategies for your 2021 portfolio?

    Speak with one of our Financial Planners to help you navigate these exciting times, either book a meeting or get in contact with us on 02 9328 0876.


    This article was prepared by William Bracey and Dr Shane Oliver. Dr Shane Oliver who provides economic forecasts and analysis of key variables and issues affecting, or likely to affect, all asset markets. He also provides economic forecasts and analysis of key variables and issues affecting, or likely to affect, all asset markets.

    Important note: While every care has been taken in the preparation of this document, AMP Capital Investors Limited (ABN 59 001 777 591, AFSL 232497) and AMP Capital Funds Management Limited (ABN 15 159 557 721, AFSL 426455) make no representations or warranties as to the accuracy or completeness of any statement in it including, without limitation, any forecasts. Past performance is not a reliable indicator of future performance. This document has been prepared for the purpose of providing general information, without taking account of any particular investor’s objectives, financial situation or needs. An investor should, before making any investment decisions, consider the appropriateness of the information in this document, and seek professional advice, having regard to the investor’s objectives, financial situation and needs. This document is solely for the use of the party to whom it is provided.

    General Disclaimer: This article contains information that is general in nature. It does not take into account the objectives, financial situation or needs of any particular person. You need to consider your financial situation and needs before making any decisions based on this information. Please seek personal financial advice prior to acting on this information.