Review of 2020 and the 2021 road to recovery
2020 – not what it was supposed to be
2020 didn’t exactly turn out the way I or many expected a year ago. For Australia, the year started badly as severe drought had given way to the worst bushfires on record. But just as the bushfires were receding it gave way to the coronavirus pandemic. Every year has a big surprise but they don’t usually have such a profound impact as the coronavirus pandemic has.
It caused a massive health crisis claiming at least 1.5 million lives, with many countries seeing at least two waves.
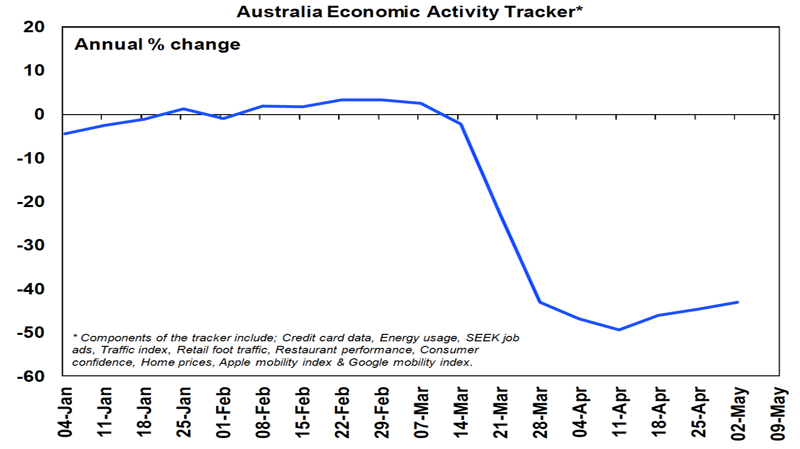
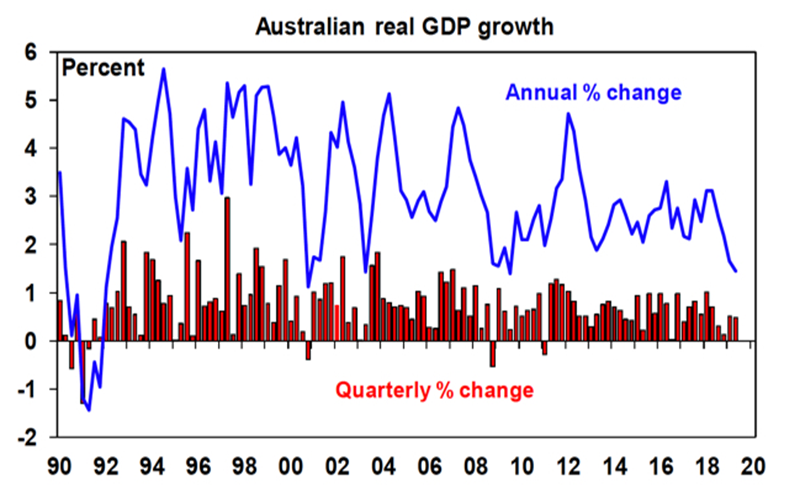
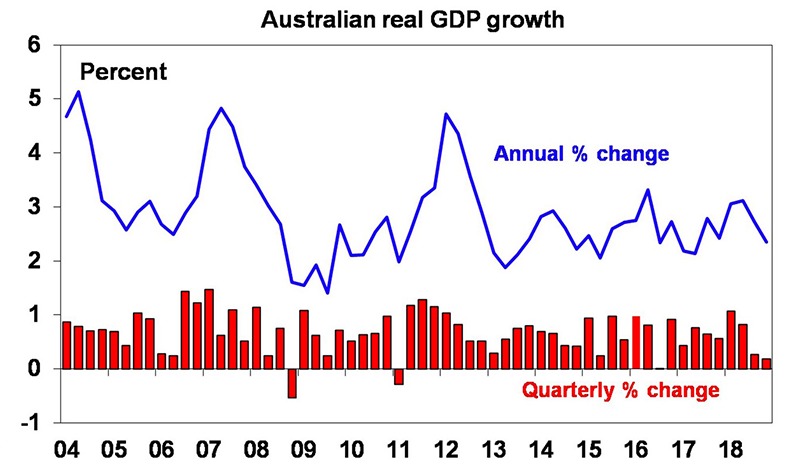
It shut down big chunks of economies, driving the biggest fall in economic activity since the end of WW2 if not the Great Depression, with major economies seeing peak to trough falls in GDP of 10% to 20% and the Australian economy contracting by 7.3%. This saw unemployment surge and inflation plunge.
Share market prices collapsed 35% in a matter of days, commodity prices collapsed with the oil price going negative at one point as investors sought out safe havens like bonds.
And it, or rather the poor management of it, lost President Trump the US election (even though he denies losing).
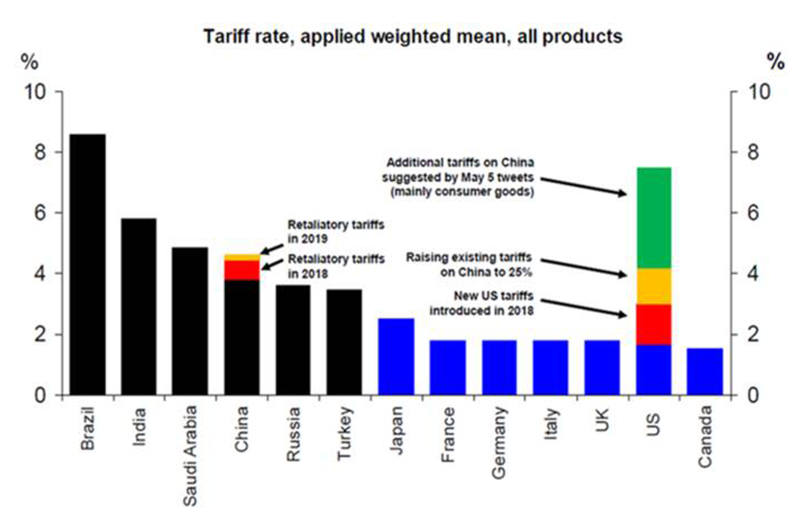
The pandemic also increased tensions with China and is likely to leave a longer-term mark with a further set back to globalisation, more social tensions, bigger government and public debt, the risk that massive money printing eventually results in higher inflation, faster structural change due to an accelerated embrace of technology, more consumer caution and a lower population in Australia due to the hit to immigration.
However, while 2020 is a year many of us would prefer to forget and coronavirus continues to wreak havoc in much of the world, the end result for economies hasn’t been as bad as had been feared back in March. This reflected a combination of:
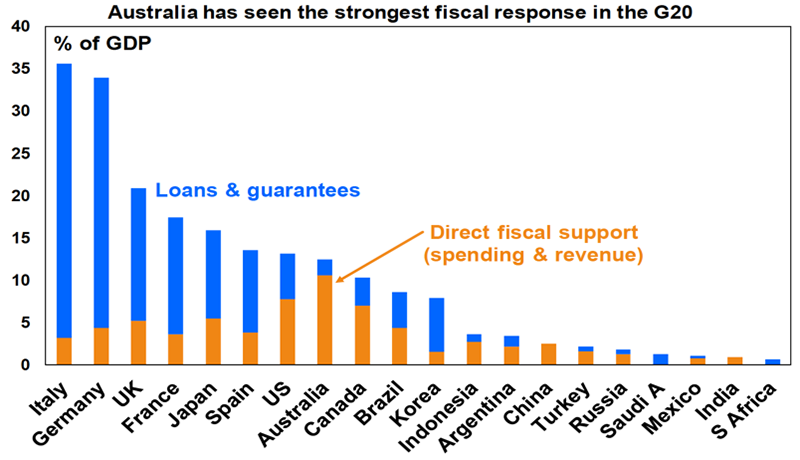
- An unprecedented and rapid fiscal stimulus that protected businesses, jobs and incomes;
- Debt forbearance schemes that headed off defaults;
- Massive monetary stimulus that saw interest rates plunge
- Social distancing which has helped contain the virus enabling some reopening – albeit better in some countries (eg, Asia, Australia and New Zealand) than others.
This enabled economic activity to bounce back fast through the second half as restrictions eased, even though it wasn’t always smooth (eg, in Victoria or in Europe and the US) and we still have a way to go to full recovery. As a result, investment markets also performed far better than feared.
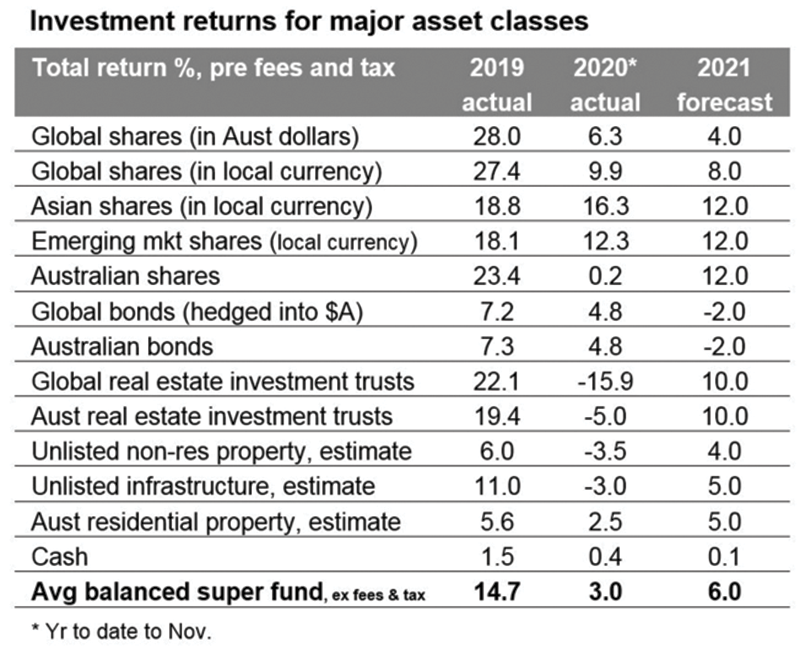
Source: Thomson Reuters, Morningstar, REIA, AMP Capital
While share markets plunged in March during the early stages of the pandemic, they then rebounded thanks to massive fiscal stimulus and reopening, low interest rates and bond yields that made shares cheap as well as good news on vaccines that enabled investors to look forward to further recovery in 2021.
This all drove solid returns in global shares with Asian and US shares (which were boosted by a relatively a high exposure to IT and initially health care stocks which benefitted from the pandemic) outperforming. The more cyclical Japanese and European markets underperformed.
Real estate investment trusts had negative returns as a result of a hit to property space demand and rents.
It was the same story for unlisted commercial property and infrastructure, although industrial property did well.
Home prices fell 3% around mid-year but then started to recover as low interest rates, government support measures and reopening swamped the hit to immigration, weak rental markets and higher unemployment. Houses, outer suburbs & regions benefitted from “escape from the city.”
Cash and bank term deposit returns were poor as the RBA cut the cash rate to just 0.1%.
2021 – recovery
Just as 2020 was dominated by the pandemic and this determined the relative performance of investment markets and stocks, 2021 is likely to be dominated by the recovery. This in turn will have a profound effect on investment markets.
There are four reasons for optimism:
First, massive fiscal and monetary stimulus is still feeding through economies with very high saving rates indicating pent up demand that can be spent once confidence improves, which will also help offset the wind down of some support measures like JobKeeper in Australia.
Second, the news on vaccines is positive. While uncertainties remain, by end 2021 or early 2022 there is a good chance the world will be approaching a degree of herd immunity.
Third, a new US president in Joe Biden should usher in a period of more stable and expert based policy making in what is still the world’s biggest economy. In particular, it will likely head off a return to trade wars that could have wreaked havoc in 2021. A more diplomatic US approach to resolving differences with China could also help Australia move down a path to resolving its own differences with China.
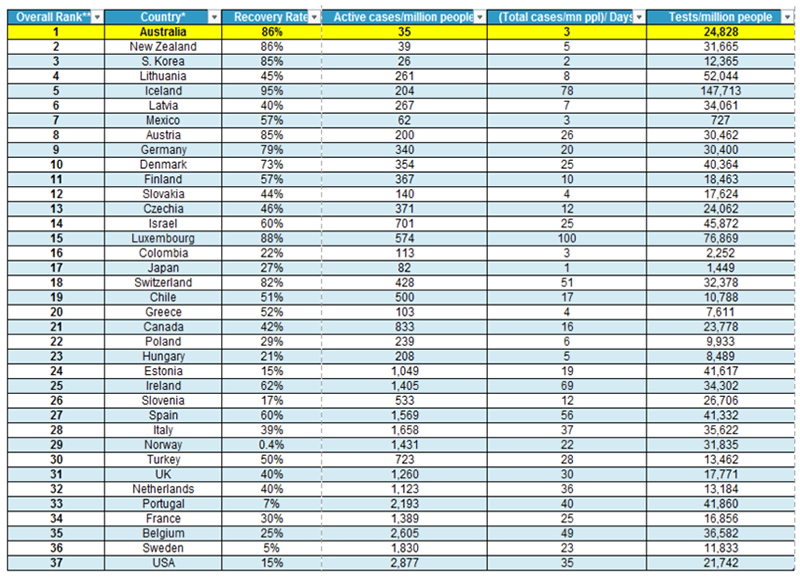
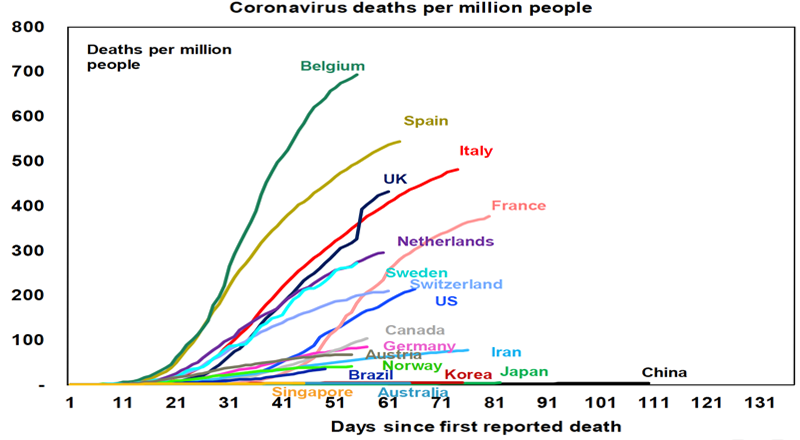
Finally, Australia along with NZ has navigated 2020 remarkably well, controlling coronavirus far better than most comparable countries and seeing its politicians and institutions work well together. It also led to structural reforms that may help future growth (eg, property tax reform in NSW, IR reform nationally).
The combination of vaccines, policy stimulus and pent up demand is expected to see a supercharged cyclical rebound in global GDP of around 5.2% and 4.5% in Australia in 2021. This is likely to see strong double-digit rebounds in profit growth.
Inflation is likely to remain weak, reflecting still high levels of spare capacity which in turn means interest rates will remain low. While this is not good for those relying solely on bank interest, it benefits the household sector as a whole (with debt exceeding bank deposits) & corporates, eases the servicing of high public debt levels and makes shares cheap. So, in a way we remain in the sweet spot of the investment cycle with improving growth but low rates. In Australia, the cash rate is expected to end 2021 at 0.1% but there is still a risk of more quantitative easing.
Implications for investors
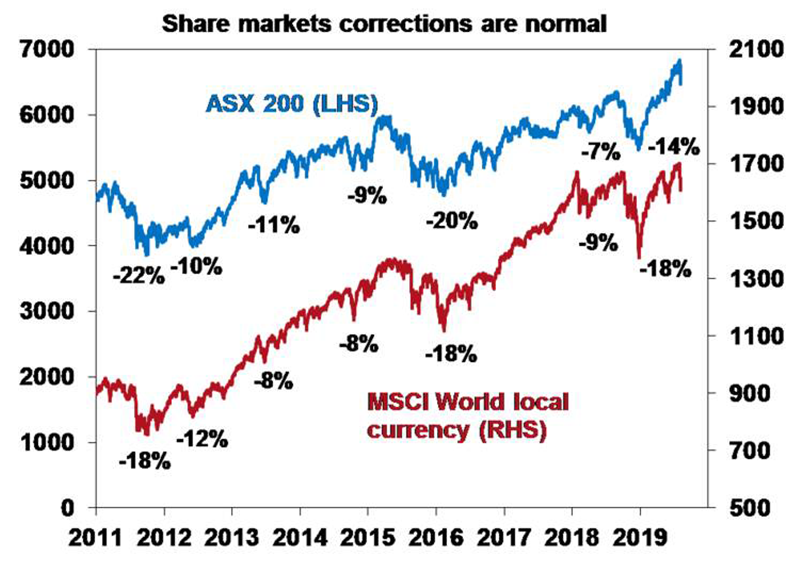
Shares are volatile. Volatility is normal and there’s always a possibility of a short-term correction after having ran up so hard in recent months since the collapse in February and 2021 is likely to see a few rough patches along the way (much like we saw in 2010 after the recovery from the GFC), but looking through the inevitable short-term noise, the combination of improving global growth and low interest rates positions growth assets like shares and property well for 2021.
Global shares are expected to return around 8%, but expect a rotation away from growth heavy US shares to more cyclical markets in Europe, Japan and emerging countries.
Australian shares are also likely to be relative outperformers helped by better virus control, enabling a stronger recovery in the near term, stronger stimulus, sectors like resources, industrials and financials benefitting from the rebound in growth.
Income investors like retirees will continue to drive a search for quality yield, mainly from the share market as dividends are increased resulting in a 4.4% grossed up dividend yield.
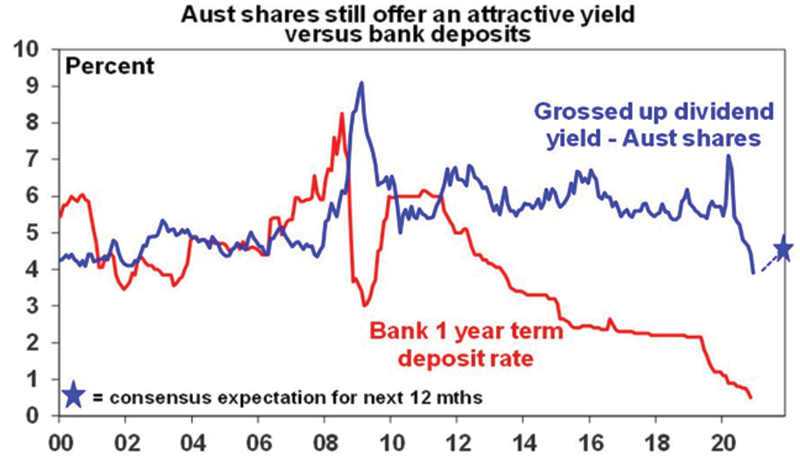
Source: Bloomberg, AMP Capital
Ultra-low yields & a capital loss from a 0.5-0.75% or so rise in yields are likely to result in negative returns from bonds.
Unlisted commercial property and infrastructure are ultimately likely to benefit from a resumption of the search for yield but the hit to space demand and hence rents from the virus will continue to weigh on near term returns.
Australian home prices are being boosted by record low mortgage rates, government home buyer incentives, income support measures and bank payment holidays but high unemployment, a stop to immigration and weak rental markets will likely weigh on inner city areas and units in Melbourne and Sydney. Outer suburbs, houses, smaller cities and regional areas will see stronger gains in 2021.
Cash and bank deposits are likely to provide very poor returns, given the ultra-low cash rate of just 0.1%.
What to watch?
The main things to keep an eye on in 2021 are as follows:
- Coronavirus and vaccines – problems with vaccines or their deployment could result in ongoing waves of new coronavirus cases & slower recovery than we are assuming.
- US politics – a Democrat victory in Georgia’s January 5 US senate elections would risk more of a leftward tilt under Biden, although conservative Democrat senators will limit this. Trump could also try to throw a spanner in the works.
- China tensions – we expect a shift to a diplomatic approach here but there is a risk of misjudgement on either side which could start to slow our longer-term economic growth rate.
- Inflation – we are assuming it remains weak but if it rebounds faster than expected it will mean faster increases in bond yields and downward pressure on asset valuations.
- The hit to immigration in Australia – 700,000 less immigrants out to mid-2023 will continue to impact on inner city Sydney and Melbourne property prices and rental incomes.
Concluding Comment
In closing, uncertainty about the future will never go away. Uncertainty is, in fact, the only certainty we have. Although 2020 was difficult due to crisis which directly impacted literally everyone, the fundamentals of free market and the adaptability of human nature prevailed.
Our clients have prospered from sticking to their financial plans and listening to our guidance. Staying the course can be difficult sometimes but it’s during the tough years like these (COVID-19, GFC, etc.) when we have proven that what we do is right – your portfolios are well diversified and well managed and if we don’t abandon them, we are well positioned to benefit, regardless of what happens. It’s the reason you hired us – to be a guide in the ever-changing landscape and provide you with what we call ‘The Value of Advice’.
After 32 years of running Sydney Financial Planning, it’s what gets me out of the bed every morning – knowing that we are here for you. Thank you for being our clients, it is a privilege to serve you.
Hope you all have Merry Christmas with your families and friends and here’s to the next adventure in 2021!
Bill and the team of Sydney Financial Planning.
Need expert advice on the best investment strategies for your portfolio?
Speak with one of our experienced Financial Planners, we’re here to help, either book a virtual meeting of get in contact with us on 02 9328 0876.
This article was prepared by William Bracey and Dr Shane Oliver. Dr Shane Oliver who provides economic forecasts and analysis of key variables and issues affecting, or likely to affect, all asset markets. He also provides economic forecasts and analysis of key variables and issues affecting, or likely to affect, all asset markets.
Important note: While every care has been taken in the preparation of this document, AMP Capital Investors Limited (ABN 59 001 777 591, AFSL 232497) and AMP Capital Funds Management Limited (ABN 15 159 557 721, AFSL 426455) make no representations or warranties as to the accuracy or completeness of any statement in it including, without limitation, any forecasts. Past performance is not a reliable indicator of future performance. This document has been prepared for the purpose of providing general information, without taking account of any particular investor’s objectives, financial situation or needs. An investor should, before making any investment decisions, consider the appropriateness of the information in this document, and seek professional advice, having regard to the investor’s objectives, financial situation and needs. This document is solely for the use of the party to whom it is provided.
General Disclaimer: This article contains information that is general in nature. It does not take into account the objectives, financial situation or needs of any particular person. You need to consider your financial situation and needs before making any decisions based on this information. Please seek personal financial advice prior to acting on this information.