Nine reasons why recession remains unlikely in Australia
Introduction
Australian economic growth has slowed to the weakest since the GFC. Talk of recession remains all the rage. And economists don’t have a great track record in predicting recessions globally – with an IMF study finding that of 153 recessions seen in 63 countries around the world between 1992 and 2014, economic forecasters only predicted five in April of the year before they started – so why should they pick one this time? As someone who forecast two of the last one recessions in Australia I am a bit wary. Perhaps the best way to predict recessions would be to forecast one every year and then you would have a perfect track record in predicting them! Some actually do this. But they are totally useless because they miss out on the 90% or so of the time that countries are not in recession and the positive lead this provides for share markets and other growth assets.
Recessions come along when there is a shock to the system (usually high interest rates), invariably at a time when the economy is vulnerable after a period of excess (such as rapid growth in spending, debt or inflation). The shock causes a loss of confidence, lots of little spending decisions are delayed and excesses are unwound. But given the natural tendency of most economies to grow given population growth and new innovations, increasing economic diversity, counter cyclical economic policies and the rise of the more stable services sector recessions are relatively rare at around 10-12% of the time globally. In Australia the last one was 28 years ago.
Why there has been no recession for 28 years
The absence of an Australian recession – whether defined by two quarterly GDP contractions in a row or negative annual growth – for 28 years is instructive. Many forecast recessions at the time of the 1997-98 Asian crisis, 2000-2002 tech wreck, the GFC and from around 2012 as the mining investment boom ended. But it didn’t happen. There are seven reasons why:
- economic reforms made the economy more flexible;
- the floating of the $A has seen it fall whenever there is a major economic problem providing a shock absorber;
- desynchronised cycles across industry sectors;
- strong growth in China that helped through the GFC;
- strong population growth;
- counter cyclical economic policy – like stimulus payments and monetary easing that helped in the GFC; and
- good luck – which can never be ignored lest hubris set in!
But is our luck running out?
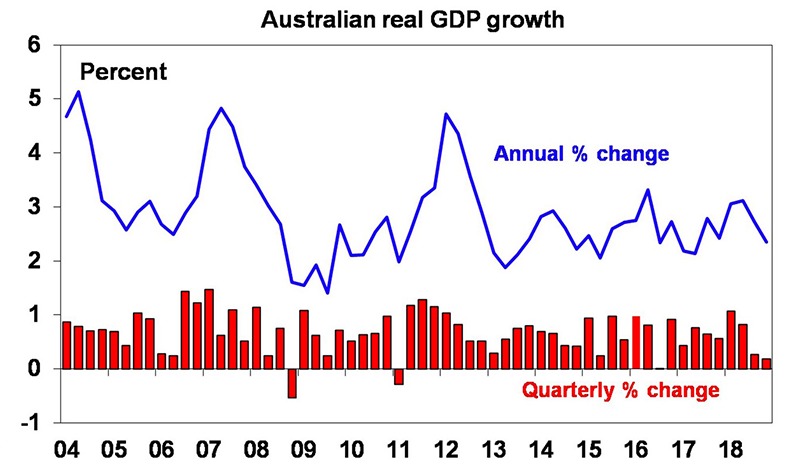
June quarter GDP growth was just 0.5%. And annual growth has fallen to 1.4% which is the slowest since the GFC and below population growth of 1.6%. Housing and business investment fell, and consumer spending remains very weak. Were it not for public spending and net exports the economy would have gone backwards in the June quarter.
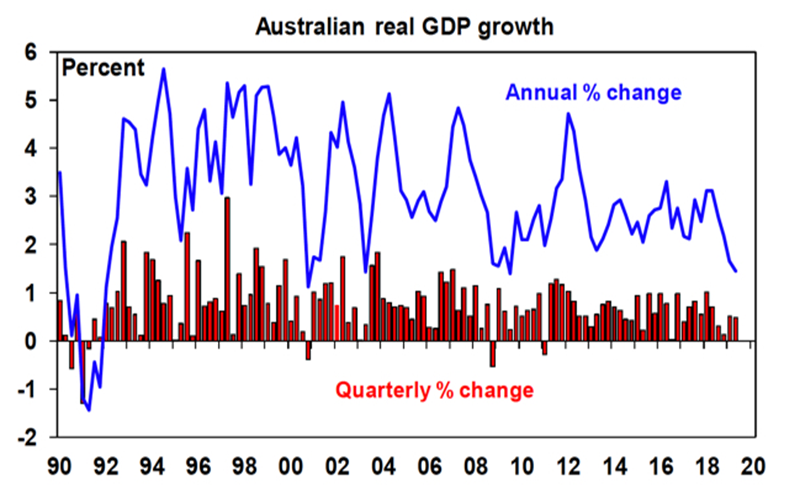
Source: ABS, AMP Capital
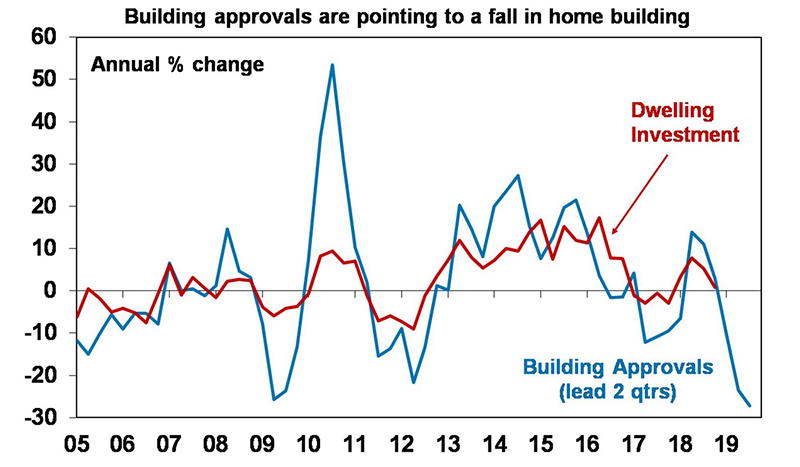
Going forward, the housing downturn has further to run with building approvals pointing to a further fall in home building.
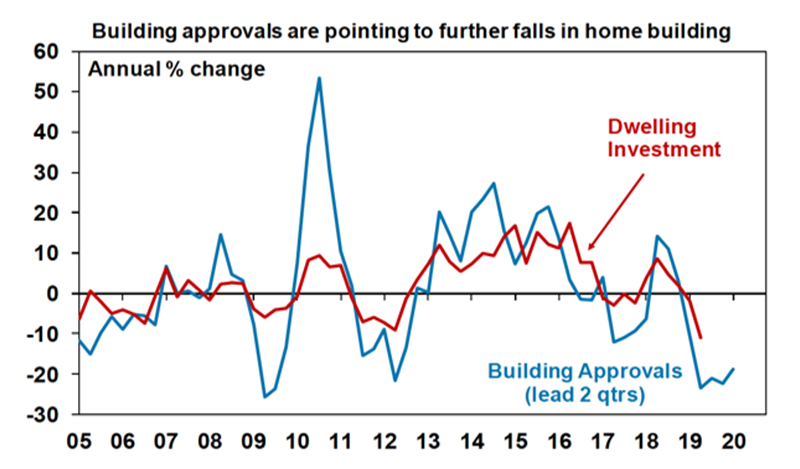
Source: ABS, AMP Capital
This is likely to amount to a 0.5-0.6 percentage point pa direct detraction from growth. This along with low property turnover (less people moving) and lagged negative wealth effects from the earlier fall in house prices will all act as drags on consumer spending. In total the housing downturn is likely to detract around 1-1.2 percentage points from growth in the year ahead.
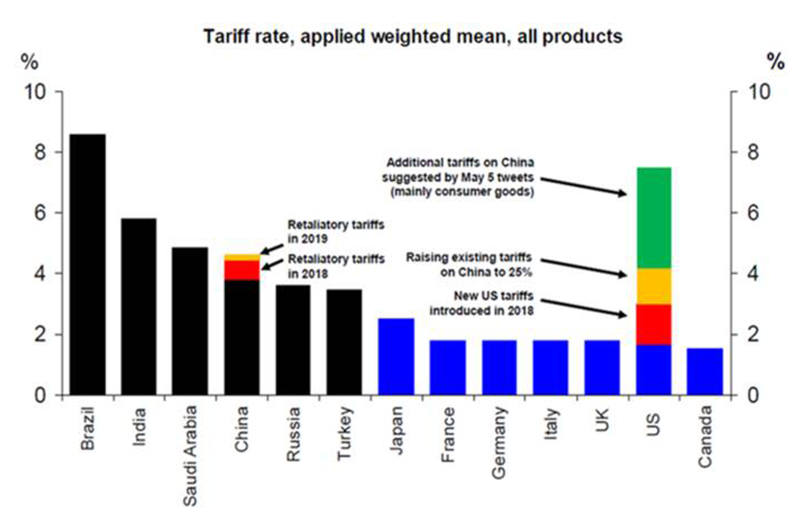
The drought will likely also act as an ongoing drag on growth with a “mild” El Nino hanging around although this may be modest at around a 0.2 percentage point growth detraction. The threats to global growth from trade wars also suggests downside risks to export growth.
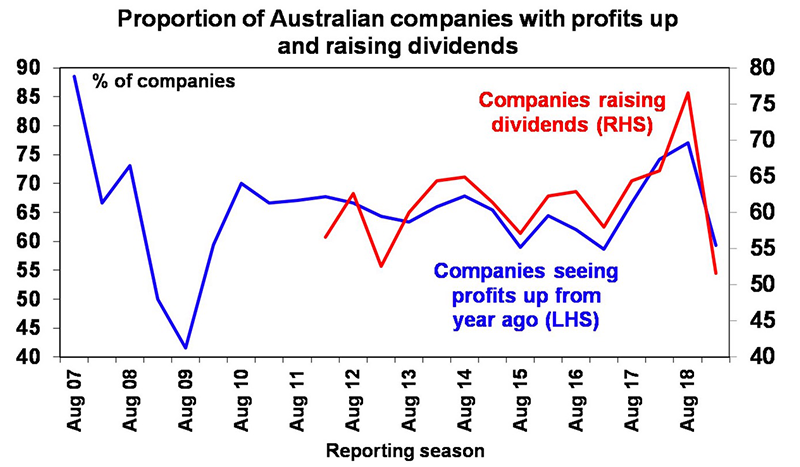
The weakness in relation to the economy is clearly evident in soft profit results in the recent June half year profit reporting season. The ratio of upside surprise to downside was the weakest since 2009, only 58% of companies saw profits rise from a year ago and the proportion of companies raising or maintaining their dividends fell to the lowest since 2011 suggesting a lack of confidence. Earnings growth slowed to 1.3% and excluding resources stocks was around -2.4%.
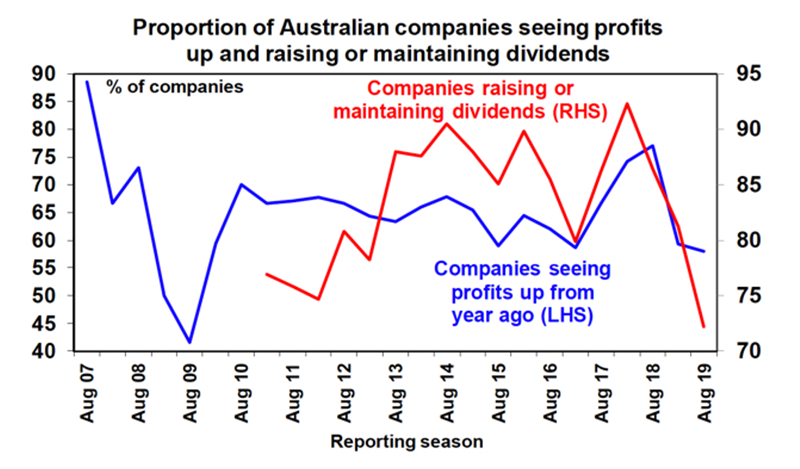
Source: AMP Capital
Slow growth but probably not recession
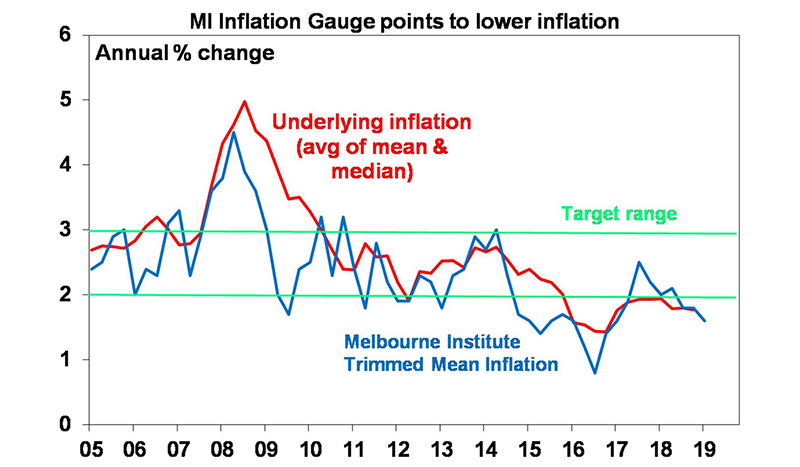
Since last year our view has been less upbeat on growth than the consensus and notably the RBA. This remains the case as the housing construction cycle turns down and weighs on consumer spending. As a result, it’s hard to see much progress in reducing high combined levels of unemployment and underemployment, and hence wages growth and inflation are likely to remain low. But there remains a bunch of positives that should help the economy avoid a recession even though growth will remain weak for a while yet. Here are nine.
- Rate cuts and tax cuts should provide some growth boost – while July retail sales were disappointing, the experience from the GFC stimulus payments is that the tax cuts will provide some lift to growth in the months ahead and various retailers have expressed optimism about this recently.
- The threat of crashing property prices looks to be receding – while it’s so far been on low volumes, buyer interest has returned to the Sydney and Melbourne markets and we never saw the much-feared surge in non-performing loans or forced selling. This has helped remove the threat of a debilitating negative wealth effect on consumer spending.
- Infrastructure spending is booming – recent state budgets saw the projected peak in infrastructure spending pushed out yet another year to 2020. And it’s likely states will seek to take even greater advantage of ultra-low long-term borrowing costs to further push out the peak in infrastructure spending.
- The low $A is helping to support the economy – the $A is down 39% from its 2011 high and is likely to fall further and this provides a boost to Australian businesses that compete internationally by making them more competitive.
Source: ABS, AMP Capital
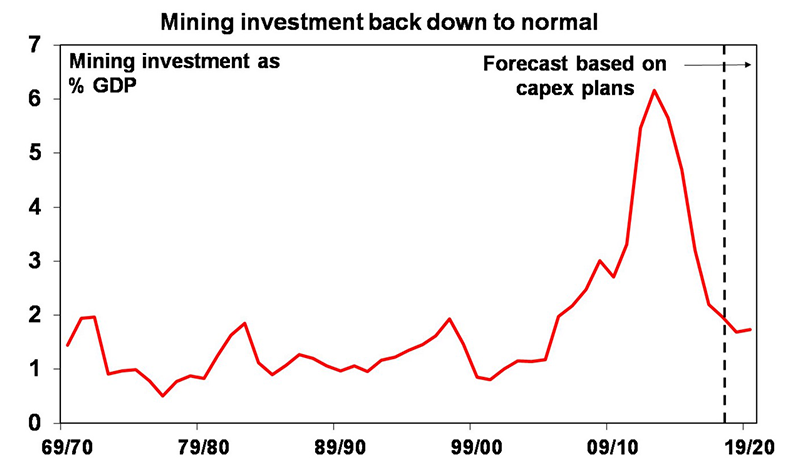
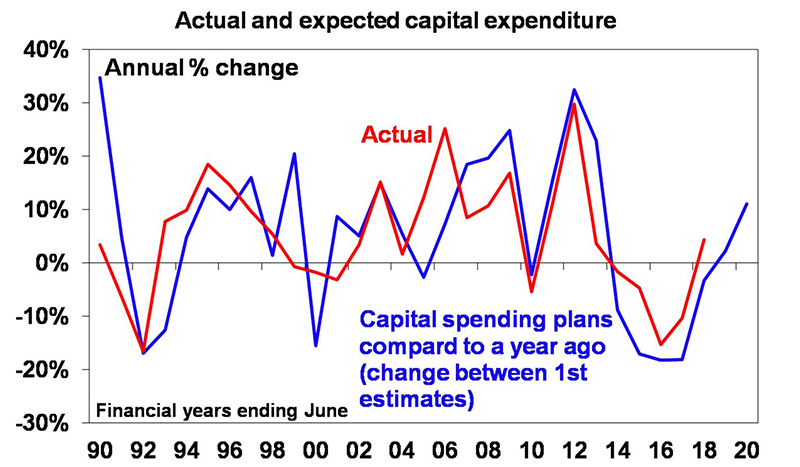
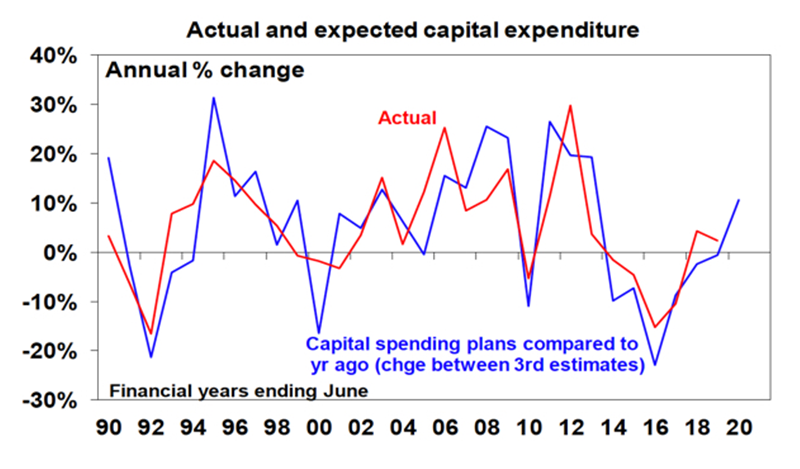
- The business investment outlook is slowly improving – the big drag on growth as mining investment fell back to more normal levels as a share of GDP is over and mining investment plans are rising. This is driving some pick-up in the outlook for overall business investment.
- Australia has a current account surplus – the June quarter saw the first current account surplus since 1975. The slide since then in iron ore and coal prices suggests it may not be sustained, but the reasons for the improvement are more than just commodity prices so the deficit is likely to be well below the norm of recent decades going forward. What’s more there has been a significant improvement in our foreign liabilities with a less short-term debt and a growing net equity position. This all means that our reliance on foreign capital inflow has declined. So much for the boiling frog!
- There is scope for extra fiscal stimulus – the Federal budget is nearly back in surplus and while we have had a long run of deficits our public finances are in good shape compared to the US, Europe and Japan. As a result, there is scope to provide more fiscal stimulus and this is probably more important than a narrow focus on the surplus.
- Population growth remains strong – Australia’s population growth at around 1.6% pa remains strong. Of course, strong population growth is not without issues and in terms of living standards it is economic growth per person (or per capita) that matters. But solid population growth also has significant benefits in terms of supporting demand growth, preventing lingering oversupply and keeping the economy dynamic.
- Finally, cyclical spending (consumer durables, housing and business investment) as a share of GDP remains low – suggesting that apart from bits of the housing market there’s not a lot of excess in the economy that needs to be unwound.
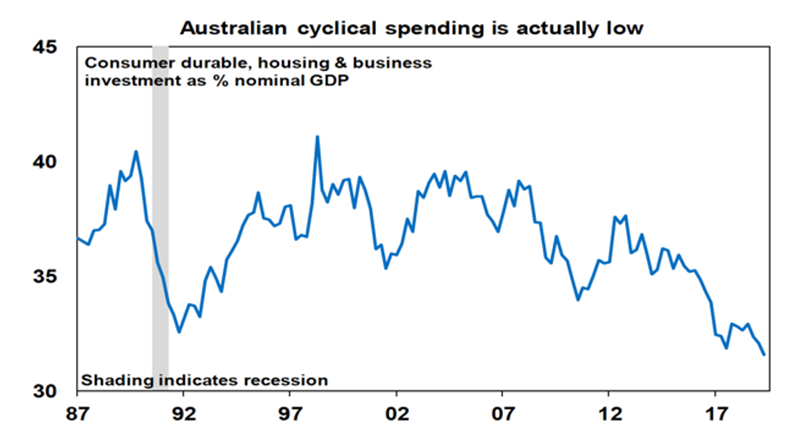
Source: Bloomberg, ABS, AMP Capital
Concluding comment
Our assessment remains that growth will remain soft and that the RBA will have to provide more stimulus – by taking the cash rate to around 0.5% and possibly consider unconventional monetary policy like quantitative easing. Ideally the latter should be combined with fiscal stimulus which would be fairer and more effective. While Australian growth is going through a rough patch with likely further to go, recession remains unlikely barring a significant global downturn.
Have you set things up to weather this trend?
If you need your personal situation reviewed by your SFP Planner or you don’t have a planner yet, get in contact with us on 02 9328 0876.
Bill Bracey – Principal & Senior Financial Planner | Sydney Financial Planning
This article was prepared by Dr Shane Oliver. Dr Shane Oliver who provides economic forecasts and analysis of key variables and issues affecting, or likely to affect, all asset markets. He also provides economic forecasts and analysis of key variables and issues affecting, or likely to affect, all asset markets.
Important note: While every care has been taken in the preparation of this document, AMP Capital Investors Limited (ABN 59 001 777 591, AFSL 232497) and AMP Capital Funds Management Limited (ABN 15 159 557 721, AFSL 426455) make no representations or warranties as to the accuracy or completeness of any statement in it including, without limitation, any forecasts. Past performance is not a reliable indicator of future performance. This document has been prepared for the purpose of providing general information, without taking account of any particular investor’s objectives, financial situation or needs. An investor should, before making any investment decisions, consider the appropriateness of the information in this document, and seek professional advice, having regard to the investor’s objectives, financial situation and needs. This document is solely for the use of the party to whom it is provided.
This article contains information that is general in nature. It does not take into account the objectives, financial situation or needs of any particular person. You need to consider your financial situation and needs before making any decisions based on this information.