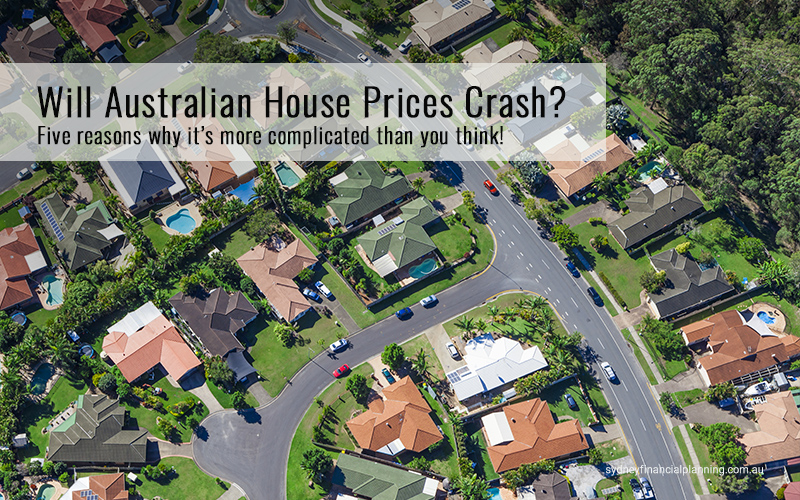
Will Australian House Prices Crash?
This year I’m using help from a friend, Dr Shane Oliver, someone who I highly respect and been following for over 20 years. He’s also an individual with a great track record. Generally people who last in this industry get it right a lot. Clients put their money with winners not losers. I would highly recommend you read this article as I think he’s got it right.
Key points:
- Talk of a property crash is likely to ramp up again with signs that the Sydney and Melbourne property markets are cooling. But the Australian property market is a lot more complicated than the crash calls suggest.
- We continue to expect a 5-10% downswing in Sydney and Melbourne property prices but a crash is unlikely and other capital cities will perform better.
- It remains a time for property investors to exercise caution and focus on laggard or higher-yielding markets.
Introduction
A common narrative on the Australian housing market is that it’s in a giant speculative bubble propelled by tax breaks, low interest rates and “liar loans” that have led to massive mortgage stress and that it’s all about to go bust, bringing down the banks and the economy with it. Recent signs of price falls – notably in Sydney – have added interest to such a view.
The trouble is we have been hearing the same for years. Calls for a property crash have been pumped out repeatedly since early last decade. In 2004, The Economist magazine described Australia as “America’s ugly sister” thanks in part to a “borrowing binge” and soaring property prices. At the time, the OECD estimated Australian housing was 51.8% overvalued. Property crash calls were wheeled out repeatedly after the Global Financial Crisis (GFC) with one commentator losing a high-profile bet that prices could fall up to 40% and having to walk to the summit of Mount Kosciuszko as a result. In 2010, a US newspaper, The Philadelphia Trumpet, warned “Pay close attention Australia. Los Angelification (referring to a 40% slump in LA home prices around the GFC) is coming to a city near you.” At the same time, a US fund manager was labelling Australian housing as a “time bomb”. Similar calls were made last year by a hedge fund researcher and a hedge fund: “The Australian property market is on the verge of blowing up on a spectacular scale…The feed-through effects will be immense… the economy will go into recession.” Over the years these crash calls have even made it on to 60 Minutes and Four Corners.
The basic facts on Australian property are well known:
- It’s expensive relative to income, rents, its long-term trend (see the next chart) and by global standards.
- Affordability is poor – price to income ratios are very high and it’s a lot harder to save a sufficient deposit.
- The surge in prices has seen a surge in debt that has taken our household debt to income ratio to the high end of OECD countries, which exposes Australia to financial instability should households decide to cut their level of debt.
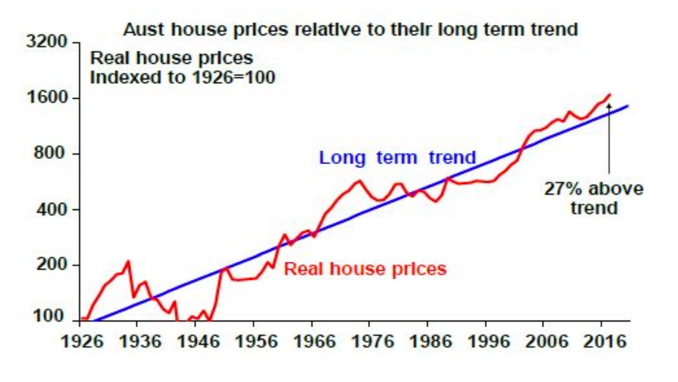
Source: ABS, AMP Capital
These things arguably make residential property Australia’s Achilles heel. But as I have learned over the last 15 years, it’s a lot more complicated than the crash calls suggest.
First, it’s dangerous to generalise
While it’s common to refer to “the Australian property market”, only Sydney and Melbourne have seen sustained and rapid price gains in recent years. On CoreLogic data over the last five years dwelling prices have risen at an average annualised rate of 11.4% per annum (pa) in Sydney and 9.4% pa in Melbourne but prices in Brisbane, Adelaide, Hobart and Canberra have risen by a benign 3 to 5% pa and prices have fallen in Perth and Darwin.
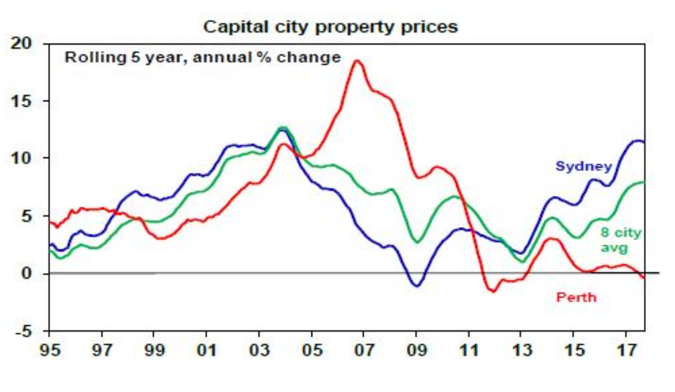
Source: CoreLogic, AMP Capital
Australian cites basically swing around the national average with prices in one or two cities surging for a few years and then underperforming as poor affordability forces demand into other cities. This can be seen in the next chart with Sydney leading the cycle over the last 20 years and Perth lagging.
Second, supply has not kept up with demand
Thanks mostly to an increase in net immigration, population growth since mid-last decade has averaged 368,000 people pa compared to 218,000 pa over the decade to 2005, which requires roughly an extra 55,000 homes per year.
Unfortunately, the supply of dwellings did not keep pace with the surge in population growth (see the next chart) so a massive shortfall built up driving high home prices. Thanks to the recent surge in unit supply this is now being worked off. But there is no broad based oversupply problem.
Consistent with this, average capital city vacancy rates are around long-term average levels, are low in Sydney and are falling in Melbourne (helped by surging population growth).
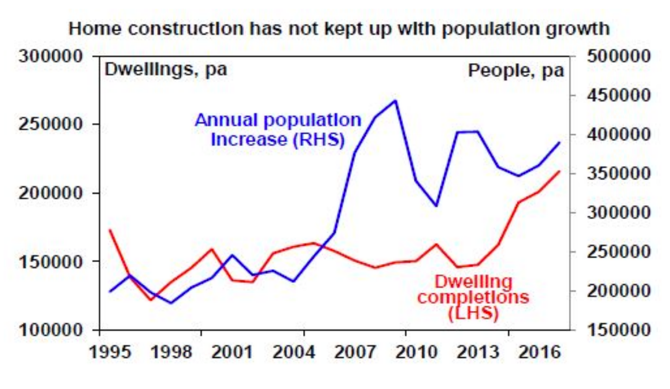
Source: ABS, AMP Capital
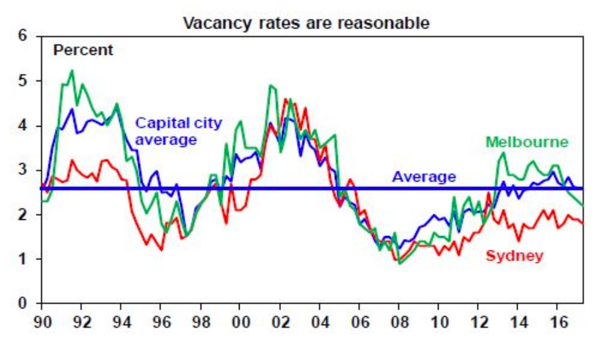
Source: Real Estate Institute of Australia, AMP Capital
Third, lending standards have been improving
For all the talk about “liar loans”, Australia has not seen anything like the deterioration in lending standards other countries saw prior to the GFC. Interest-only loans had been growing excessively but are not comparable to so-called NINJA (no income, no job, no asset) sub-prime and low-doc loans that surged in the US prior to the GFC. Interest-only and high loan to valuation loans have also been falling lately. And much of the increase in debt has gone to older, wealthier Australians, who are better able to service their loans.
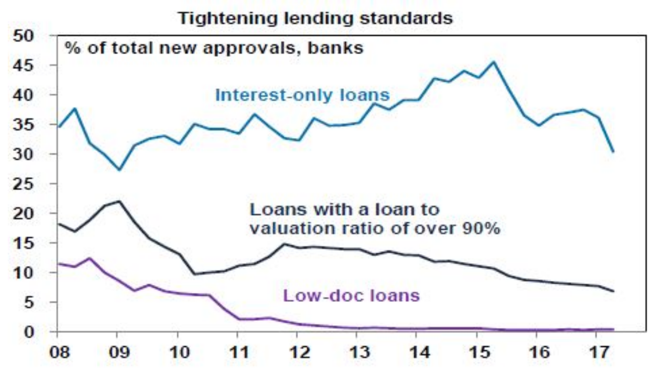
Source: APRA, AMP Capital
Yes, I know various surveys report high levels of mortgage stress. But we heard the same continuously last decade from the Fujitsu Mortgage Stress Survey and yet there was no crash. By contrast, RBA research shows that while getting into the housing market is hard “those who make it are doing ok” and bad debts and arrears are low. Finally, debt interest payments relative to income are running around 30% below 2008 peak levels thanks to low interest rates. Sure, rates will eventually start to rise again but they will need to rise by around 2% to take the debt interest to income ratio back to the 2008 high.
Fourth, the importance of tax breaks is exaggerated
A range of additional factors like tax breaks and foreign buyers have played a role but their importance is often exaggerated relative to the supply shortfall. While there is a case to reduce the capital gains tax discount (to remove a distortion in the tax system), negative gearing has long been a feature of the Australian tax system and if it’s the main driver of home price increases as some claim then what happened in Perth and Darwin? Similarly, foreign buying has been concentrated in certain areas and so cannot explain high prices generally, particularly with foreign buying restricted to new properties.
Finally, the conditions for a crash are not in place
To get a housing crash – say a 20% average fall or more – we probably need much higher unemployment, much higher interest rates and/or a big oversupply. But it’s hard to see these.
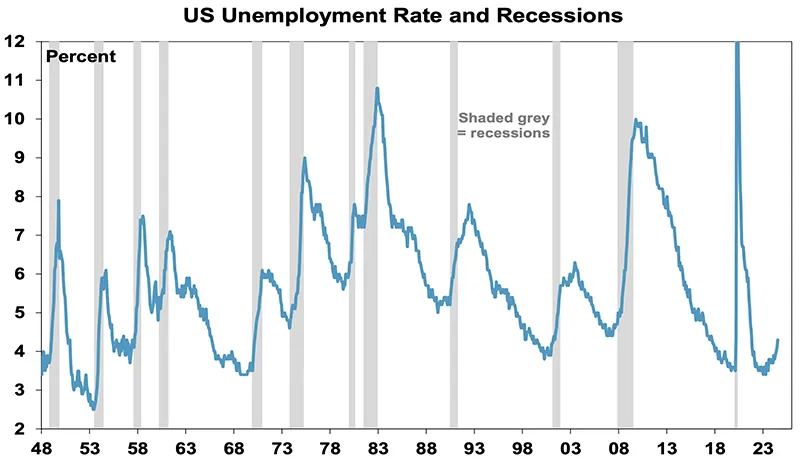
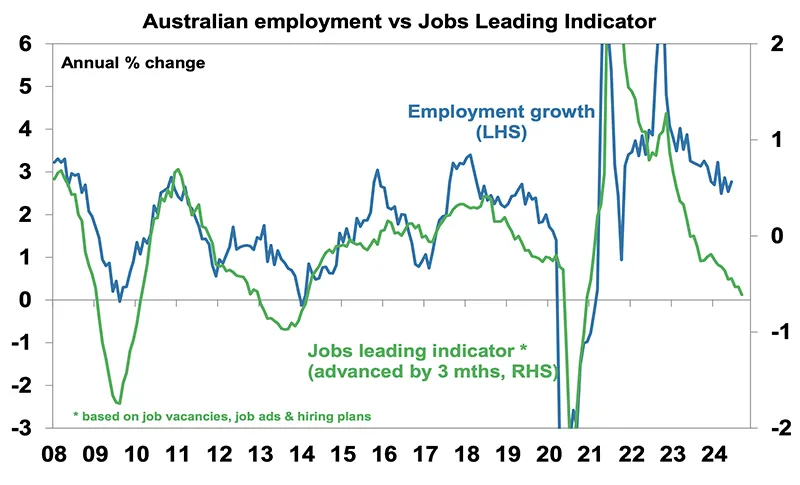
- There is no sign of recession and jobs data remains strong.
- The RBA is likely to start raising interest rates next year, but it knows households are now moresensitive to higher rates & will move only verygradually – like in the US – and won’t hike by more than it needs to to keep inflation on target.
- Property oversupply will become a risk if the current construction boom continues for several years but with approvals to build new homes slowing this looksunlikely.
Don’t get me wrong, none of this is to say that excessive house prices and debt levels are not posing a risk for Australia. But it’s a lot more complicated than commonly portrayed.
So where are we now?
That said, we continue to expect a slowing in the Sydney and Melbourne property markets, with evidence mounting that APRA’s measures to slow lending to investors and interest-only buyers (along with other measures, eg to slow foreign buying) are impacting. This is particularly the case in Sydney where price growth has stalled and auction clearance rates have fallen to near 60%. Expect prices to fall 5-10% (maybe less in Melbourne given strong population growth) over the next two years. This is like what occurred around 2005, 2008-09 & 2012.
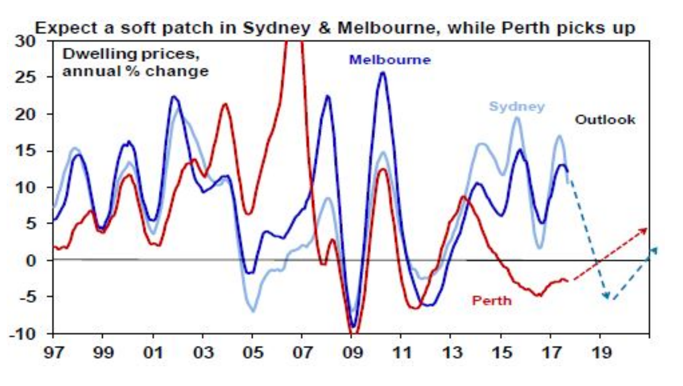
Source: CoreLogic, AMP Capital
By contrast, Perth and Darwin home prices are likely close to the bottom as mining investment is near the bottom. Hobart and increasingly Brisbane and Adelaide are likely to benefit from flow on or “refugee” demand from Sydney and Melbourne having lagged for many years.
Implications for investors
Housing has a long-term role to play in investment portfolios, but the combination of the strong gains in the last few years in Sydney and Melbourne, vulnerabilities around high household debt levels as official interest rates eventually start to rise and low net rental yields mean investors need to be careful. Sydney and Melbourne are least attractive in the short term. Best to focus on those cities and regional areas that have been left behind and where rental yields are higher. So there you have it. Let’s see if we got it right next year.
Concluding comment
So there you have it. Let’s see if we got it right next year.
Bill Bracey FChFP
Principal Sydney Financial Planning
Authorised Representative Charter Financial Planning
Still have some questions?
If you want to discuss any cocerns or implications on your property investing with one of our advisors. Call us to arrange an appointment on 02 9328 0876.
This main article was prepared by Dr Shane Oliver. Dr Shane Oliver, Head of Investment Strategy and Economics and Chief Economist at AMP Capital is responsible for AMP Capital’s diversified investment funds. He also provides economic forecasts and analysis of key variables and issues affecting, or likely to affect, all asset markets.
General Disclaimer: This article contains information that is general in nature. It does not take into account the objectives, financial situation or needs of any particular person. You need to consider your financial situation and needs before making any decisions based on this information. Please seek personal financial advice prior to acting on this information.
Important note: While every care has been taken in the preparation of this document, AMP Capital Investors Limited (ABN 59 001 777 591, AFSL 232497) and AMP Capital Funds Management Limited (ABN 15 159 557 721, AFSL 426455) make no representations or warranties as to the accuracy or completeness of any statement in it including, without limitation, any forecasts. Past performance is not a reliable indicator of future performance. This document has been prepared for the purpose of providing general information, without taking account of any particular investor’s objectives, financial situation or needs. An investor should, before making any investment decisions, consider the appropriateness of the information in this document, and seek professional advice, having regard to the investor’s objectives, financial situation and needs. This document is solely for the use of the party to whom it is provided.