
Author: Britt Ambrose

The income or growth conundrum

The income or growth conundrum

The income or growth conundrum

We love investment income at SFP, because it adds real money to your investment account which you can use in the real world. Don’t get me wrong, capital growth is great (both the income and capital are important considerations for any investment), however, until you sell something it’s not real money we can use at the shops. And the problem with selling investments is that we then have to give up the future income from it. A bit of a conundrum.

They say, “horses for courses”. Depending on what life stage you’re in will depend on what investment return you might be favouring. Our accumulator clients might be focusing more on capital growth, whereas our retired clients might be more focused on a growing income from their investments.

Investment income may come in the form of interest, rent, dividends or distributions (as they call them from managed funds). The quality of the income is determined by the quality of the underlying investment, with consistency and reliability being two important factors we deem to be represented in quality income. The other important factor is the ability for the income to increase over time.

If you’re accumulating wealth over the longer-term, your focus is likely to be on capital growth, with income generated from that investment being used to purchase additional investments. However, there comes a point in time where your capital has grown sufficiently, and now your focus will be more on generating income to support your lifestyle.

If you need to access capital to fund your lifestyle expenses, you become a forced seller and must accept what the market gives you. This is generally not a situation many of our accumulator clients have dealt with, as we can set a retirement target date and plan accordingly, so we know when we’re likely going to need to access our investment capital.

The greatest challenge is for our pre-retiree or retiree clients, in that they may be in a situation where they have insufficient cash to fund their next pension payment. If the underlying investments produce sufficient income to top-up your cash account, then you won’t need to sell assets to fund your withdrawals, which is an ideal scenario.

This is where having a well-defined strategy comes into play, and why it forms an important part of our planning process for clients in retirement, or close to retirement. By looking ahead, we can determine the optimal timing for adjusting your investment strategy, as well as consider appropriate underlying investments to meet your needs going forward.

Re-investing dividends provides the opportunity to grow your portfolio at a greater pace over time, compared to banking your dividends. This applies regardless of whether you’re putting additional funds in or not, the dividends will be used to purchase more shares or units in your portfolio. This is known as “compounding returns”.

Where your strategy is largely to build your portfolio over a long period of time and your personal circumstances enable this to happen consistently (generally while you’re working) then re-investing dividends has proven to be an effective strategy.

However, if you require a regular income from your investments (such as in retirement), your dividends may be better served being directed to your cash or transaction account. This will in effect ‘top up’ your cash account and allow you to continue funding your income needs.

The decision to re-invest income, or allocate income to cash, really depends on your overall needs and there may be a combination of both of these approaches built into your overall plan.


Article by Steven Stolle
Financial Planner | Director


Does your portfolio have a long-term investing strategy in place?

Speak with one of our Financial Planners about the best investing approach for your circumstances, call 02 9328 0876 to arrange a meeting.


General Disclaimer: This article contains information that is general in nature. It does not take into account the objectives, financial situation or needs of any particular person. You need to consider your financial situation and needs before making any decisions based on this information. Please seek personal financial advice prior to acting on this information.


Support Michal Bodi in the 2023 MS Gong Ride

Ride Michal Ride!!

Support Michal Bodi in the 2023 MS Gong Ride

Since 1981, this iconic ride has raised significant funds to help fight MS. Michal is passionate about aligning his two loves riding and a desire to make a difference by being a part of this incredible annual fundraiser.

Why will Michal ride? 

In 2001 Michal was introduced to multiple sclerosis through a volunteering program in the UK. Living and working with people suffering with this horrible illness Multiple Sclerosis (MS) brought Michal a lot of perspective about the disease and through witnessing first hand the impact on the lives of friends, clients and the community. He hopes that his ride can contribute to helping find a cure and assist those with MS to have support and quality of life.

Did you know that every week 10 Australians are diagnosed with multiple sclerosis? It’s quite staggering to think that multiple sclerosis affects more young people than any other chronic neurological condition. The average age of diagnosis is 30 years, and there is no known cure.

The team at Sydney Financial Planning are supporting Michal’s ride and raised over $700 to make a difference. Michal is currently sitting on over $2,400 (… and counting! This amount will be updated after the ride), smashing his goal of $1,000!!! 

AMP Foundation has also offered to match every dollar that Michal raises for this really amazing cause ?

If you also wish to donate and support Michal and his cause, please click on the link below. Your donation can help make sure that no one faces MS alone. Your support will help people with multiple sclerosis receive the vital support, treatments, and services to help them live well at home, remain connected to their work and also to continue to be part of their community.

Simply click on the link below to make a donation through Michal’s official fundraising page:

Support Michal’s efforts.

When you make your donation, you’ll receive a tax-deductible receipt immediately. 

Thank you so much for your support.
Michal Bodi and the SFP team.


Support Michal in achieving his goal…

Visit Michal’s fundraiser page to donate and track his progress.


Focusing on the right thing with investing

Focusing on the right thing

Focusing on the right thing with investing

2022 could have gone into the books as an unrelievedly ‘bad’ year, indeed quite the worst one since the onset of the Global Financial Crisis in 2008. But of course, that isn’t the case because the share prices are just one aspect of their total return.

The other is dividends – the actual cash disbursements companies make to their owners (shareholders) out of their earnings, and the income on which many retired investors are living. In 2022, those dividends went up just shy of 11% from 2021. You read that right, last year’s S&P 500 cash dividend was 10.8% higher than 2021’s. (It was the 13th year in a row that dividends went up, and the 11th consecutive record high.)

That’s sort of what dividends do, and indeed it only makes common sense: since in the aggregate the 500 companies in the Index have significantly increased their earnings over time, they’ve been able – and quite willing – to reward their shareholders by raising their cash dividends. 

This wasn’t a one-year wonder. In the last 50 years – beginning with the annus horribilis 1973, the dividends went up because the earnings went up – more than 18 times.

Well fine, in fact pretty terrific. But in the next breath, you might very intelligently ask: how much of that dividend increase was lost to the erosion of purchasing power? In other words, how much did the cost of living go up in those 50 years? The answer is that the Consumer Price Index increased 6.4 times, from December 1973 to December 2022.

If that’s starting to look to you like the S&P 500’s cash dividend has quietly gone up, this half century past, close to three times more than has the cost of living, I’m happy to confirm that you’re reading the situation just exactly right.

You may wonder why no one (apart from your financial planner, who may have to be restrained from shouting it from the housetops) has ever reported this to you. Permit me to speculate: (1) It’s a pure goodness, and financial journalism tends to devote very little space to purely good things. And (2) it isn’t really “news”, but rather a cumulatively very powerful truth.

So, if some bank you’d never even heard of busted out today because it lent a bunch of money to some crypto bros, be assured that that’s just about all you’re going to be reading and hearing about for a while. Indeed, I can pretty much guarantee that “Tortoise continues inexplicably to beat hare” won’t ever be the big headline on your financial “news” feed, so you needn’t bother looking for it.

Here’s why an 11% jump in the cash dividend in spite of any temporary declines in the share prices, should have been every long-term equity investor’s key takeaway from 2022:

For the pre-retirement investor – trying with all his/her might to accumulate enough capital for retirement – it’s because a significantly increased stream of dividends was being reinvested at significantly reduced share prices. That’s the great (though somehow not obvious) beauty of compounding, as you make most of your money in a bear market; you just don’t realize it at the time.

And of course, for retired investors, it’s how their increased income may well have stayed ahead of their inflating living costs. CPI inflation was pretty dreadful in 2022, but it was nowhere near 11%. Remember: it isn’t your account statement you’ll be taking to the supermarket throughout perhaps three decades of retirement; it’s your income.

Just one man’s opinion, I guess. But if people looked up their dividend income every 90 days instead of checking their account balances every 90 minutes, they just might become markedly more successful investors.


Article by Michal Bodi

Senior Financial Planner | Partner


Does your portfolio have a long-term investing strategy in place?

Speak with one of our Financial Planners about the best investing approach for your circumstances, call 02 9328 0876 to arrange a meeting.


General Disclaimer: This article contains information that is general in nature. It does not take into account the objectives, financial situation or needs of any particular person. You need to consider your financial situation and needs before making any decisions based on this information. Please seek personal financial advice prior to acting on this information.


Transitioning into retirement? Start to get your buckets in place early.

Transitioning into retirement? Start to get your buckets in place early.

Transitioning into retirement? Start to get your buckets in place early.

However, the devils in the detail when executing a well-diversified investment portfolio and it largely depends on which life stage you’re at when selecting the right approach.

There are two approaches to implementing a well-diversified investment portfolio, the first being a diversified multi asset investment fund and the second being a well-diversified “investment bucket” portfolio approach. They both spread a client’s funds across difference asset classes to smooth the returns however one approach works especially well for our accumulator clients whilst the other is the foundation for managing our retired client’s portfolio’s.

This article focuses on the “investment bucket” diversification approach for our retired clients. This framework generally has a least 4 “buckets” ranging from the short-term bucket for transactions to the long term bucket for capital growth and protecting our clients purchasing power.

Bucket 1: The short-term bucket.

The transaction or cash account. Pays for pension payments and costs.

Think of bucket number 1 like a glass of water, as we drink from it (draw money out) the water level reduces. We need to top this glass back up to ensure we can keep drinking as retirement is thirsty work. How do we top it back up? We direct the ‘water’ from buckets 2, 3 and 4 to this bucket. That way we can keep drinking. Should the water levels fall too low we may need to sell some of the profits from buckets 3 and 4 to top back up however we only want to do this when there are profits to take, however, we need to allow sufficient time for those assets to flourish and grow.

sfp bucket 002

Bucket 2: The cash reserve.

Holds a year of pension payment provisions along with an amount reserved for emergencies and unexpected expenses.

In the event we need to top up bucket 1 within the first 5 years we can call on the reserve bucket to help us out. We can use these funds at a pinch to ensure there’s enough water (or cash) in bucket 1 to draw on. This is our contingency account for what ifs. Needs to be readily accessible. Could be a high interest cash managed fund and a Term Deposit (depending on how much we’re holding in reserve).


sfp bucket 003

Bucket 3: The medium-term bucket.

Our 5–7-year money with a focus on delivering steady, reliable, and growing income.

Generally invested with the primary goal to provide growing income and ensure asset value keeps pace with inflation to preserve the purchasing power of our funds. This bucket generally invests largely in blue chip Australian shares with a focus on paying fully franked dividends, infrastructure and bonds with high yields. As we all know the cost of living doesn’t stop increasing for anybody and retirees know they need to be drawing a higher income each year.

sfp bucket 004

Bucket 4: The long-term bucket.

Our 7 – 10-year money. Invested largely in growth assets such as shares and property with a timeframe of 7-10 years.

Our primary investment objective for this bucket is to preserve the purchasing power of our capital. Therefore, this bucket’s goal is to produce capital growth along with some income. Income from this bucket is directed to bucket number 1 (or reinvested in we can afford it).

When should I start transitioning to an “investment bucket: portfolio approach?

There’s no set answer however generally speaking allowing somewhere between 3 and 5 years prior to retirement is best practice and allows sufficient time to build up our short and medium term buckets. We’ll be raising this with you at your annual progress meeting.


Gary Winwood-Smith
Director | Senior Financial Planner


Do you need help with the conundrum of income or growth?

Speak with one of our Financial Planners about the best investment strategy for your circumstances, call 02 9328 0876 to arrange a meeting.


General Disclaimer: This article contains information that is general in nature. It does not take into account the objectives, financial situation or needs of any particular person. You need to consider your financial situation and needs before making any decisions based on this information. Please seek personal financial advice prior to acting on this information.


Recession & volatile world markets

Volatile world markets

Recession & volatile world markets

You are not alone! Last year I forewarned the continuing volatility of the financial markets and Australian housing market. Currently, the average house prices fall is approximately 10%. We still feel that some suburbs may fall a little further, though there seems to be some leveling off overall. The concern is that as some people come out of a 2-year fixed term mortgage at 2% and go to a new variable rate of above 5%, the increase may be unaffordable and force them to sell. Time will tell.

The Australian and worlds stock market prices are showing signs of recovery after a wild ride caused by the increased interest rates, inflation, supply shortages and uncertainty thanks to Mr Putin.
Most leading economists now see the world slowing due to high interest rates and believe we will enter a period of recession worldwide. Yes, the R word! Australia may see a softer landing but still never nice, Europe a hard landing, and the USA a moderate recession. How will all these events affect my portfolio that is managed by Sydney Financial Planning?

Well, as we go into a recession the worlds governments will need to stimulate the economy. In Australia like in other countries, they will begin to lower interest rates probably later this year or early next year. We will enter this next economic cycle and as interest rates fall it will stimulate growth assets. Typically, shares first, followed in time by property, but this may take some time to turn.

From a historical point, a similar cycle occurred in 1973-74 due the OPEC oil crisis, where the price of oil doubled. The share markets and property both fell heavily, then when the oil price came down, the interest rates went down quickly as the world went into recession and the Australian share market went up over 60 % in one year.

I’m not suggesting a huge share price uplift next year, but many past economic cycles have shown us this trend is what typically happens next.


Source: Bloomberg, AMP Capital

Here we are again, finding ourselves having to navigate through volatility for reasons out of everyone’s control. However, there are variables we can control – these include having a plan and regular guidance helping us stick to it, and investing only in quality assets, managed by quality fund managers. That is something we can choose to do, that is also something that stands the test of time. Remember only the patient will get rewarded.

In summary, still expect volatility (that never goes away and it’s completely normal and organic), interest rates will start to go down again and when they do enjoy the upward cycle. In the meantime, take advantage of this uncertainty as it provides rare buying opportunities at lower prices, helping you build wealth and securing your future.

Please feel free to call your financial planner or our mortgage broker from SFP Home Finance and we can review your situation and advise you for your future.

Bill Bracey
Founder & Managing Director


Not sure how to take advantage of this volatile market and rare opportunity?

Speak with one of our Financial Planners about the best approach for your circumstances, either book a meeting or get in contact with us on 02 9328 0876.


General Disclaimer: This article contains information that is general in nature. It does not take into account the objectives, financial situation or needs of any particular person. You need to consider your financial situation and needs before making any decisions based on this information. Please seek personal financial advice prior to acting on this information.

Five charts on investing to keep in mind in rough times like now

Five charts on investing to keep in mind in rough times like now

Five charts on investing to keep in mind in rough times like now

  • This makes it all the more important to stay focussed on the basic principles of successful investing.
  • These five charts focus on critical aspects of investing that are insightful in times of market stress: the power of compound interest; don’t get blown off by cyclical swings; the roller coaster of investor emotion; the wall of worry; & market timing is hard.
  • Introduction

    The coronavirus crisis is first and foremost a human crisis and my thoughts are particularly with those on the front line of this battle. But, of course, it’s impacting many aspects of life at present, including investment markets. Successful investing can be really difficult in times like the present when markets have collapsed into a bear market with falls globally of around 30% from their highs amidst immense uncertainty about the economic hit from coronavirus and how much policy stimulus and central bank support can head off collateral damage and boost an eventual recovery. Trying to work this out is driving huge volatility in investment markets making it very easy for short term traders to get whipsawed. I will be the first to admit that my crystal ball is even hazier than normal right now. As the US economist, JK Galbraith once said “there are two types of economists – those that don’t know and those that don’t know they don’t know.’And this is certainly an environment where much is unknown.

    But while history does not repeat in that each cycle is different it does rhyme in that each has many common characteristics. So, while we haven’t seen a pandemic driven bear market before the basic principles of investing have not changed. This note revisits five charts I find particularly useful in times of stress.

    Chart #1 The power of compound interest

    This is my favourite chart. It shows the value of $1 invested in various Australian assets in 1900 allowing for the reinvestment of dividends and interest along the way. That $1 would have grown to $242 if invested in cash, to $1017 if invested in bonds and to $481,910 if invested in shares.

    Source: Bloomberg, AMP Capital

    While the average return since 1900 is only double that in shares relative to bonds, the huge difference between the two at the end owes to the impact of compounding – or earning returns on top of returns. So, any interest or return earned in one period is added to the original investment so that it all earns a return in the next period. And so on. I only have Australian residential property data back to 1926 but out of interest it shows (on average!) similar long term compounded returns to shares..

    Key message: to grow our wealth, we must have exposure to growth assets like shares and property. While shares have collapsed lately amidst massive coronavirus uncertainty and the short-term outlook for Australian housing is vulnerable too, both will likely do well over the long-term.

    Chart #2 Don’t get blown off by cyclical swings

    The trouble is that shares can have lots of setbacks along the way as is evident during the periods highlighted by the arrows on the previous chart. Just like now. Even annual returns in the share market are highly volatile, but longer-term returns tend to be solid and relatively smooth as can be seen in the next chart.

    Since 1900, for Australian shares roughly two years out of ten have had negative returns but there are no negative returns over rolling 20-year periods.

    The higher returns shares produce over time relative to cash and bonds is compensation for the periodic setbacks they have. But understanding that these periodic setbacks are just an inevitable part of investing is important in being able to stay the course and get the benefit of the higher long-term returns shares and other growth assets provide over time.

    Source: Bloomberg, AMP Capital

    Key message: short-term sometimes violent swings in share markets are a fact of life but the longer the time horizon, the greater the chance your investments will meet their goals. So, in investing, time is on your side and it’s best to invest for the long-term when you can.

    Chart #3 The roller coaster of investor emotion

    It’s well known that the swings in investment markets are more than can be justified by moves in investment fundamentals alone – like profits, dividends, rents and interest rates. This is because investor emotion plays a huge part. This has been more than evident over the past few weeks.

    The roller coaster of investor emotion

    Source: Russell Investments, AMP Capital

    The next chart shows the roller coaster that investor emotion traces through the course of an investment cycle. Once a cycle turns down in a bear market, euphoria gives way to anxiety, denial, capitulation and ultimately depression at which point the asset class is under-loved and undervalued and everyone who is going to sell has – and it becomes vulnerable to good (or less bad) news. This is the point of maximum opportunity. Once the cycle turns up again, depression gives way to hope and optimism before eventually seeing euphoria again.

    Key message: investor emotion plays a huge role in magnifying the swings in investment markets. The key for investors is not to get sucked into this emotional roller coaster. Of course, doing this is easier said than done which is why many investors end up getting wrong footed by the investment cycle.

    Chart #4 The wall of worry

    There is always something for investors to worry about. And in a world where social media is competing intensely with old media it all seems more magnified and worrying. This is arguably evident now in relation to coronavirus uncertainty. The global economy has had plenty of worries over the last century, but it got over them with Australian shares returning 11.5% per annum since 1900, with a broad rising trend in the All Ords price index as can be seen in the next chart, and US shares returning 9.6% pa. (Note that this chart shows the All Ords share price index whereas the first chart shows the value of $1 invested in the All Ords accumulation index, which allows for changes in share prices and dividends.)

    Australian shares have climbed a wall of worry

    Source: ASX, AMP Capital

    Key message: worries are normal around the economy and investments and sometimes they become intense – like now. But they eventually pass. For example, back in mid-January it seemed the bushfires, smoke shrouding our cities and regular news of homes and lives lost would never end. But when I went to regional NSW in the last week it was lovely, green and wet. And so, it is with coronavirus – this too will pass eventually.

    Chart #5 Timing is hard

    The temptation to time markets is immense. With the benefit of hindsight many swings in markets like the tech boom and bust and the GFC look inevitable and hence forecastable and so it’s natural to think why not switch between say cash and shares within your super to anticipate market moves.

    Missing the best days and the worst days

    Covers Jan 1995 to 17 March 2020. Source: Bloomberg, AMP Capital

    This is particularly the case in times of emotional stress like now when all the news around coronavirus and its impact on the economy is bad. Fair enough if you have a process and put the effort in. But without a tried and tested market timing process, trying to time the market is difficult.

    A good way to demonstrate this is with a comparison of returns if an investor is fully invested in shares versus missing out on the best (or worst) days. The next chart shows that if you were fully invested in Australian shares from January 1995, you would have returned 8% pa (with dividends but not allowing for franking credits, tax and fees).

    Key things for SFP clients to remember

    After 35 years of advising Sydney Financial Planning clients, the key message I need to remind everyone is; we have been through this sort of volatility/storm before. As uncomfortable as it is for all – the sun will come out again, and the next upward cycle will come. We just need to weather this storm and have confidence as an advised client your portfolio is built to manage volatility.

    The last key message to remember is GFC in both 2008-2010 and COVID in 2019-2020 painful as it was at the time; we urged you to use the lower market values to buy in at lower prices and ride the wave out of the issue of the day.

    Today I’m saying the same.


    Bill Bracey – CEO and Founder | Sydney Financial Planning


    How is your long-term strategy and investment opportunity looking?

    Speak with one of our Financial Planners about the best approach for your circumstances, either book a meeting or get in contact with us on 02 9328 0876.


    This article was prepared by Dr Shane Oliver with closing summary by William Bracey – CEO & Senior Financial Planner from Sydney Financial Planning. Dr Shane Oliver who provides economic forecasts and analysis of key variables and issues affecting, or likely to affect, all asset markets. He also provides economic forecasts and analysis of key variables and issues affecting, or likely to affect, all asset markets.

    Important note: While every care has been taken in the preparation of this document, AMP Capital Investors Limited (ABN 59 001 777 591, AFSL 232497) and AMP Capital Funds Management Limited (ABN 15 159 557 721, AFSL 426455) make no representations or warranties as to the accuracy or completeness of any statement in it including, without limitation, any forecasts. Past performance is not a reliable indicator of future performance. This document has been prepared for the purpose of providing general information, without taking account of any particular investor’s objectives, financial situation or needs. An investor should, before making any investment decisions, consider the appropriateness of the information in this document, and seek professional advice, having regard to the investor’s objectives, financial situation and needs. This document is solely for the use of the party to whom it is provided.

    General Disclaimer: This article contains information that is general in nature. It does not take into account the objectives, financial situation or needs of any particular person. You need to consider your financial situation and needs before making any decisions based on this information. Please seek personal financial advice prior to acting on this information.

    The importance of ongoing work

    Our annual reviews and progress tracking excercise is an important part of financial planning because planning is an ongoing process.


    Do you have a long-term investing strategy in place?

    Speak with one of our investment specialists about the best approach for your circumstances, either book a meeting or get in contact with us on 02 9328 0876.


    General Disclaimer: While every care has been taken in the preparation of this document, Sydney Financial Planning and Charter FP make no representations or warranties as to the accuracy or completeness of any statement in it. This article contains information that is general in nature. It does not take into account the objectives, financial situation or needs of any particular person. You need to consider your financial situation and needs before making any decisions based on this information. Please seek personal financial advice prior to acting on this information.

    Importance of the right focus in planning

    ‘If we focus on what we can influence, we’re in a better position to deliver outcomes our clients expect’.
    Michal Bodi


    Do you need help on creating an investment strategy?

    Speaking with one of our investment specialist to discuss your personal situation is a great place start, get in contact with our team to book a call on 02 9328 0876.


    General Disclaimer: While every care has been taken in the preparation of this document, Sydney Financial Planning and Charter FP make no representations or warranties as to the accuracy or completeness of any statement in it. This article contains information that is general in nature. It does not take into account the objectives, financial situation or needs of any particular person. You need to consider your financial situation and needs before making any decisions based on this information. Please seek personal financial advice prior to acting on this information.

    Market volatility and how to benefit

    What is market volatility and how can you can potentially benefit?

    Volatility has been around for a long time, and we can learn from history.


    Is your share portfolio well positioned for long-term returns and benefits?

    Lets discuss your personal situation, to arrange an appointment with one of our investment specialists, contact our team on 02 9328 0876.


    General Disclaimer: While every care has been taken in the preparation of this document, Sydney Financial Planning and Charter FP make no representations or warranties as to the accuracy or completeness of any statement in it. This article contains information that is general in nature. It does not take into account the objectives, financial situation or needs of any particular person. You need to consider your financial situation and needs before making any decisions based on this information. Please seek personal financial advice prior to acting on this information.

    2022 review & 2023 outlook

    SFP Insights – 2022 review & 2023 outlook

    2022 review & 2023 outlook

  • 2023 is likely to remain volatile and a retest of 2022 lows for shares is a high risk. But easing inflation, central banks getting off the brakes (with the RBA at or close to the peak on rates), economic growth likely stronger than feared & improved valuations should make for better returns.
  • Australian residential property prices likely have more downside, ahead of a September quarter low.
  • The main things to keep an eye on are: inflation; central banks and interest rates; US politics; China tensions; and Australian residential property prices.
  • 2022 – from Covid to inflation & surging interest rates

    The good news is that 2022 finally saw the world shake off the grip of Coronavirus as it transitioned from a pandemic to endemic (albeit it’s still causing problems in China). However, the past year turned out far more difficult for investors than might have been thought a year ago:

    • Inflation, which already rose in 2021 surged to levels not seen for decades, largely reflecting pandemic related distortions to supply and reopening & a stimulus driven surge in demand & floods in Australia.
    • Russia invaded Ukraine, leading to a surge in energy & food prices.
    • Central banks moved to aggressively withdraw monetary stimulus and raised interest rates at the fastest pace seen in decades to deal with inflation and rising inflation expectations.
    • Bond yields surged in response to the rise in inflation & interest rates.
    • Chinese growth fell sharply, reflecting its zero-Covid policy and a continuing property downturn despite policy stimulus.
    • Geopolitical tensions surged with war in Ukraine and worries about a Chinese invasion of Taiwan following President Xi Jinping’s power consolidation, although there were hopes of a thaw near year end.
    • As a result of all this, investors increasingly fretted about recession.
    • Tech stocks and crypto currencies, having been the biggest winners of the Covid lockdowns & easy money, were hit hard by reopening and monetary tightening, ultimately proving no hedge against inflation.

    Growth was still ok – but a lot weaker than expected

    Despite these problems, global GDP is still expected to have come in at around 3.2% which is weaker than the 5% or so growth expected a year ago and down from 6% in 2021, but still reasonable as reopening and stimulus helped. And in Australia, GDP is expected to have been around 3.5%, lower than expected a year ago and down from 4.8% in 2021, but still reasonable. The growth slowdown saw a slowdown in profits. But the main problem for investment markets was the rise in inflation, interest rates and bond yields.

    Investment returns for major asset classes

    Total return %, pre fees and tax 2021 actual 2022* actual 2023 forecast
    Global shares (in Aust dollars) 29.6 -12.5 4.0
    Global shares (in local currency) 24.3 -16.4 7.0
    Asian shares (in local currency) -6.8 -18.3 10.0
    Emerging mkt shares (local currency) -0.2 -15.5 10.0
    Australian shares 17.2 -1.1 10.0
    Global bonds (hedged into $A) -1.5 -12.3 3.0
    Australian bonds -2.9 -9.7 4.0
    Global real estate investment trusts 30.9 -25.9 9.0
    Aust real estate investment trusts 26.1 -20.5 9.0
    Unlisted non-res property, estimate 12.3 11.5 4.0
    Unlisted infrastructure, estimate 12.0 10.0 5.0
    Aust residential property, estimate 23.0 -7.0 -7.0
    Cash 0.0 1.3 3.1
    Avg balanced super fund, ex fees & tax 14.3 -5.2 6.3

    *Year to date to Nov. Source: Thomson Reuters, Morningstar, REIA, AMP

    • Global shares had a rough year with a plunge of 23% into October on inflation, interest rate and recession worries, before a rally cut losses.
    • Chinese shares led the weakness, not helped by its zero Covid policy, followed by Asian shares, given their exposure to China and cyclical sensitivity. US shares also underperformed reflecting its high-tech exposure & aggressive Fed tightening.
    • Australian shares outperformed, helped by strong commodity prices and a relatively less hawkish RBA.
    • Government bonds slumped as yields surged on high inflation & rate hikes. Australian bonds had their worst year since 1973 or the 1930s.
    • Real estate investment trusts fell with the surge in bond yields.
    • Unlisted property & infrastructure returns remained strong, being less sensitive to short-term share market and bond yield moves.
    • Home prices fell sharply reflecting poor affordability after a boom &, particularly, as mortgage rates rose, reducing home buyer capacity.
    • Cash and bank term deposit returns improved but were still low.
    • The $A fell with share markets on growth concerns and relatively aggressive Fed rate hikes into October, before a partial recovery.
    • Balanced super funds had negative returns reflecting poor share and bond returns. This followed very strong returns in 2021.

    2023 – lower inflation and lower growth

    First the bad news: inflation is still way too high at around 7 to 11% in many advanced countries; tight labour markets risk wage-price spirals; central banks are still warning of more rate hikes; the risk of recession is high with inverted yield curves and weak confidence largely in response to rate hikes; the US has returned to divided Government with the risk of debt ceiling and funding standoffs; war continues in Ukraine; and tensions remain with China and Iran. Even Covid continues to disrupt – but mainly in China as cases surge as it reopens. These all suggest another volatile year and possibly continuation of the bear market in global shares.

    Global composite PMI vs world GDP

    PMIs are surveys of business confidence and conditions. Source: Bloomberg, IMF, AMP

    However, there is reason for optimism. First, inflationary pressures may have peaked and are slowing rapidly (as reflected in our Pipeline Inflation Indicator): supply chain pressures have eased; demand is cooling; and labour markets are showing signs of topping out. In fact, it may only require a slight pull back in demand (to push capacity utilisation back down to normal & unemployment above the NAIRU – or non-accelerating inflation rate of unemployment, with the return of immigration helping in Australia) to further depress inflationary pressure significantly. This suggests inflation could fall faster than central banks expect in 2023.

    Second, central banks are likely nearing the peak in rates. The Fed is already moving to slow hikes, but conditions are likely to be soft enough to allow it to pause from around March ahead of rate cuts later in 2023. Sure, its signalling more but just as its signals were too dovish a year ago its signals now are likely too hawkish! In Australia, we see the RBA as being at or close to the top (3.1% is our base case for the peak with 3.35% our risk case) as by February/March conditions are likely to be weak enough to allow a pause, ahead of rate cuts in late 2023/early 2024.

    AMP pipeline inflation indicator

    Note that this is more a guide to direction than level. Source: Bloomberg, AMP

    Third, it seems everyone is talking about recession for 2023, such that it’s a consensus call. The risk is very high (probably over 50% in the US and Europe) and this will likely keep markets volatile given the threat to earnings. But it may not turn out to be as bad as feared.

    • In the US it may just be a sharp slowdown or mild recession in 2023 – if the Fed starts to ease up on the brake soon and given the absence of other excesses that need to be unwound, eg, there has been no overinvestment in housing & capex and leverage is low.
    • Europe has moved away from Russian gas very quickly and providing its winter is mild, may continue to hold up better than feared.
    • Or lags in the way rate hikes impact may mean recession does not hit till 2024, meaning its too early for share markets to discount just yet.
    • After initial Covid related setbacks, Chinese growth is likely to rebound in 2023 as it reopens. Just like occurred in other countries upon reopening (recall Australia’s Omicron disruptions earlier in 2022) China is likely to see a surge in cases initially. But markets are likely to largely look through this to the reopening boost ahead which will provide an offset to slower growth in the US and Europe.
    • Australian growth is likely to slow but avoid recession, reflecting the less aggressive RBA, the pipeline of home building work yet to be completed and the strong business investment outlook.

    Finally, geopolitics may not be so bad in 2023: there are no major elections in key countries in 2023; the war in Ukraine may not get any more threatening; and the Cold War with China may see a bit of a thaw.

    Overall, global growth in 2023 is likely to be around 2.5%, well down from 6% in 2021, but not recession in aggregate. In Australia, growth is expected to slow to 1.5% in the year ahead. And inflation is likely to fall.

    Implications for investors

    Easing inflation pressures, central banks moving to get off the brakes, economic growth proving stronger than feared and improved valuations should make for better returns in 2023. But there are likely to be bumps on the way – particularly regarding recession risks – & this could involve a retest of 2022 lows or new lows in shares before the upswing resumes.

    • Global shares are expected to return around 7%. The post mid-term election year normally results in above average gains in US shares, but US shares are likely to remain a relative underperformer compared to non-US shares reflecting still higher price to earnings multiples (17.5 times forward earnings in the US versus 12 times forward earnings for non-US shares). The $US is also likely to weaken which should benefit emerging and Asian shares.
    • Australian shares are likely to outperform again, helped by stronger economic growth than in other developed countries and ultimately stronger growth in China supporting commodity prices and as investors continue to like the grossed-up dividend yield of around 5.5%. Expect the ASX 200 to end 2023 at around 7,500.
    • Bonds are likely to provide returns around running yield or a bit more, as inflation slows and central banks become less hawkish.
    • Unlisted commercial property and infrastructure are expected to see slower returns, reflecting the lagged impact of weaker share markets and higher bond yields (on valuations).
    • Australian home prices are likely to fall further as rate hikes continue to impact, resulting in a top to bottom fall of 15-20%, but with prices expected to bottom around the September quarter, ahead of gains late in the year as the RBA moves toward rate cuts.
    • Cash and bank deposits are expected to provide returns of around 3%, reflecting the back up in interest rates through 2022.
    • A rising trend in the $A is likely over the next 12 months, reflecting a downtrend in the now overvalued $US, the Fed moving to cut rates and solid commodity prices helped by stronger Chinese growth.

    Key things for SFP clients to remember

    The Lord giveth and taketh! 2021 he gave and 2022 he took back some of the gains.

    2023 will be dominated by again high volatility, but for our advised clients who rode the storm out over the past 2 years, still overall were rewarded. My continued quote in 2021 and in 2022  was “that’s how the rich get richer and the poor poorer”.  

    In November 2021, I wrote to you warning the Financial Markets will get the wobbles over the next 12 months. Wow was that spot on!. Volatility will remain the key feature of 2023.

    Key issues to watch

    • Inflation being tamed.
    • US Politics.
    • The worlds Governments being all highly leveraged in debt after COVID and the need to lower debt, in a controlled way as interest rates go up.
    • China- Taiwan issues.
    • Ukraine conflict effecting Europe.
    • Australian House prices continuing to fall or stable out. 

    We are not out of the woods yet! but for our advised clients who we help navigate these choppy waters, the medium to longer term rewards will be there. History has proven in periods like this once the volatility passes we will return to sound growth and higher returns.

    Patience Grasshopper!  

    Bill Bracey – CEO and Founder
    Sydney Financial Planning


    Is your share portfolio well positioned for long-term returns and benefits?

    Speak with one of our Financial Planners about the best approach for your circumstances, either book a meeting or get in contact with us on 02 9328 0876.


    This article was prepared by William Bracey and Dr Shane Oliver. Dr Shane Oliver who provides economic forecasts and analysis of key variables and issues affecting, or likely to affect, all asset markets. He also provides economic forecasts and analysis of key variables and issues affecting, or likely to affect, all asset markets.

    Important note: While every care has been taken in the preparation of this document, AMP Capital Investors Limited (ABN 59 001 777 591, AFSL 232497) and AMP Capital Funds Management Limited (ABN 15 159 557 721, AFSL 426455) make no representations or warranties as to the accuracy or completeness of any statement in it including, without limitation, any forecasts. Past performance is not a reliable indicator of future performance. This document has been prepared for the purpose of providing general information, without taking account of any particular investor’s objectives, financial situation or needs. An investor should, before making any investment decisions, consider the appropriateness of the information in this document, and seek professional advice, having regard to the investor’s objectives, financial situation and needs. This document is solely for the use of the party to whom it is provided.

    General Disclaimer: This article contains information that is general in nature. It does not take into account the objectives, financial situation or needs of any particular person. You need to consider your financial situation and needs before making any decisions based on this information. Please seek personal financial advice prior to acting on this information.

    Volatility = premium returns

    Shares sliding again – what’s driving it and is there any light at the end of the tunnel?

    Volatility = premium returns

  • With the rising risk of global recession, global and Australian shares are at high risk of further falls in the short term.
  • However, it’s not all negative. Pipeline inflation pressures are continuing to decline and inflation expectations remain relatively low which should enable central banks to become less hawkish from later this year. Share market seasonality also improves into December and the direction setting US share market normally sees strong gains after mid-term elections.
  • Introduction

    Investors could be forgiven for looking back on the pandemic years of 2020 and 2021 with fond memories – because after the initial shock in February-March 2020 it was a period of strong returns and relative calm in investment markets. This year has been anything but.

    Share markets back down

    Source: Strategas, AMP

    After falling sharply into mid-June (at which point US shares had fallen 24% from their highs, global shares 21% and Australian shares 16%), share markets rallied into mid-August reversing half of their declines on the back of hopes the Fed would pivot towards an easier monetary stance and hopefully avoid a recession. Since mid-August though shares have fallen again and are now back to around their June lows.

    And, bond yields have pushed up again with US, UK, German 10-year yields rising to levels not seen in a decade.

    What’s driving the renewed weakness

    The plunge in shares back to their June lows mostly reflects the same concerns that drove the falls into June:

    • Inflation remains high or is still rising depending on the country. For example, US headline inflation is still 8.3%yoy and core inflation at 6.3%yoy in August is still under pressure from rising services inflation. Headline inflation is 8.9% in the UK, 9.1% in Europe, 9.9% in the UK and an estimated 7.2% in Australia.
    • Global central banks have become more hawkish noting that permanently high inflation will lead to lower living standards and the longer inflation stays high the greater the risk that inflation expectations move higher, making it harder to get down. As a result, they are committed to getting it back to target and have been flagging more rate hikes (eg with the dot plot of Fed interest rate forecasts around 1% higher than 3 months ago) and an implied tolerance for a recession in order to get it under control.

    Australian equity bear markets and us recessions

    Source: ASX, Bloomberg, AMP

    • Increasingly hawkish central banks are bad for shares in the short term for two reasons. First higher interest rates and make shares less attractive from a valuation perspective. Second, a recession would weigh on company profits. Recession is now almost certain in Europe and about a 50% probability in the US. In Australia the probability of recession is now around 40% (if as we expect the cash rate peaks around 3%, but if it rises to 4.3% as predicted by the money market then recession is probable here). Historically deep bear markets in US and Australian shares have tended to be associated with a US recession.
    • Fears of an escalation of the Ukraine war – after Russia’s troop mobilisation, “referenda” to incorporate occupied areas into Russia and a threat to use nuclear weapons. Ongoing tensions with China and the approaching November US mid-term elections are not helping.
    • A large fiscal stimulus in the UK has caused a surge in UK bond yields & plunge in the pound adding to fears of a crisis. While the new Government’s tax cuts and deregulation may have supply side merit the benefits of this tend to take years to become apparent and in the meantime the risk is that it adds to inflation and fears about runaway debt.
    • We are in a weak period of the year seasonally for shares – with September being the weakest month of the year on average for shares and October known for volatility. This can be magnified when the trend in shares is down.
    • As seen in the first half the year, tech stocks and particularly crypto currencies remain the biggest losers of monetary tightening, after being the biggest winners of easy money.

    Shares are oversold and on technical support at their June lows so could bounce from here. But the risks are skewed to the downside in the short term. While investor confidence is very negative, we have yet to see the sort of spike in put/call option ratios or VIX that normally signals major market bottoms. The RBA is fortunately starting to sound a bit more balanced and aware of the way monetary policy impacts with a lag, but the danger is that the Fed and central banks have become locked into supersized hikes based on backward looking inflation and jobs data, and a loss of confidence in their ability to forecast inflation at a time when they should be giving more attention to monetary policy lags. This increases the risk of overtightening driving a deep recession with earnings downgrades driving another leg down in share prices (after the first leg down which was driven by rising bond yields). A decisive break below the June low for the US share market could open up another 10% leg down with a similar flow through to Australian shares.

    It’s not all doom and gloom

    However, there is some light at the end of the tunnel on a 12-month view:

    • Central banks determination to stop high inflation becoming entrenched is good news from a longer-term perspective as the 1970s experience tells us that the alternative would be bad for economies, jobs and investment markets.
    • Producer price inflation looks to have peaked in the US, UK, China and Japan.
    • This is consistent with our Pipeline Inflation Indicator which is continuing to trend down given falling price and cost components in business surveys, falling freight rates and lower commodity prices (outside of gas and coal).

    AMP pipeline inflation indicator

    Source: Bloomberg, AMP

    • Some of the key components that initially drove higher inflation in the US are starting to slow with weakening growth in new market rents (which with a lag drives about 33% of the US CPI) and softening used car prices.
    • Consumer inflation expectations have fallen in the US and Australia, helped by aggressive central bank moves and falling petrol prices. US 5 year plus inflation expectations have fallen back to 2.8% which is well below the near 10% level seen in 1980. This should make it easier for central banks to get inflation back down without having to take interest rates to exorbitant levels.
    • Money supply growth has slowed from its 2020 surge, and this is likely to contribute to lower inflation ahead.
    • Post US mid-term election returns tend to be strong, just as mid-term election year drawbacks tend to be more severe – with an average top to bottom fall of 17% in US shares in mid-term election years followed by an average 33% gain one year from the low.

    US mid term election share market drawdowns

    Source: AMP

    The bottom line is that while short-term inflation remains high, these considerations are consistent with the US having reached peak inflation and point to lower inflation ahead which should enable central banks to slow the pace of hiking by year end, in time to avoid a severe recession.

    If this applies in the US, then Australia should follow as its lagging the US by about six months with respect to inflation. (Although we expect the RBA to slow the pace of rate hikes well ahead of the US – given the greater sensitivity of the Australian household sector to higher rates than in the US and lower inflation pressures in Australia.) For this reason, while short term risks around shares remain high, we remain optimistic on shares on a 12-month horizon.

    Key things for SFP clients to remember

    Sharp share market falls are stressful for investors as no one likes to see their investments fall in value. And try as one may, it’s never easy to accurately predict economies and shares.

    1. share market pullbacks are healthy and normal – their volatility is the price we pay for the higher returns they provide over the long term;
    2. it’s very hard to time market moves so the key is to stick to an appropriate long-term investment strategy;
    3. selling shares after a fall locks in a loss;
    4. share pullbacks provide opportunities for investors to buy them more cheaply;
    5. shares invariably bottom with maximum bearishness;
    6. Australian shares still offer an attractive income (or cash) flow relative to bank deposits; and
    7. to avoid getting thrown off a long-term strategy – it’s best to turn down the noise around all the negative news flow.

    In closing, market volatility is a real investor’s friend, and the key is to embrace it. I have also recorded a video for you to watch on this topic (please watch until the end). If you are still concerned, we encourage you to talk to your adviser and call 02 9328 0876.

    Bill Bracey – CEO and Founder
    Sydney Financial Planning


    Is your share portfolio well positioned for long-term returns and benefits?

    Speak with one of our financial planners about the best approach for your circumstances, either book a meeting or get in contact with us on 02 9328 0876.


    This article was prepared by William Bracey and Dr Shane Oliver. Dr Shane Oliver who provides economic forecasts and analysis of key variables and issues affecting, or likely to affect, all asset markets. He also provides economic forecasts and analysis of key variables and issues affecting, or likely to affect, all asset markets.

    Important note: While every care has been taken in the preparation of this document, AMP Capital Investors Limited (ABN 59 001 777 591, AFSL 232497) and AMP Capital Funds Management Limited (ABN 15 159 557 721, AFSL 426455) make no representations or warranties as to the accuracy or completeness of any statement in it including, without limitation, any forecasts. Past performance is not a reliable indicator of future performance. This document has been prepared for the purpose of providing general information, without taking account of any particular investor’s objectives, financial situation or needs. An investor should, before making any investment decisions, consider the appropriateness of the information in this document, and seek professional advice, having regard to the investor’s objectives, financial situation and needs. This document is solely for the use of the party to whom it is provided.

    General Disclaimer: This article contains information that is general in nature. It does not take into account the objectives, financial situation or needs of any particular person. You need to consider your financial situation and needs before making any decisions based on this information. Please seek personal financial advice prior to acting on this information.

    Investing under uncertainty

    Investing under uncertainty

    Investing under uncertainty

    Uncertainty is here to stay; we have no say in that. So, we spend time and energy on keeping our heads down and continuing to fund our plan – we have a full control over that.

    Here we are in a tectonic shift in the world’s geopolitical order, occasioned by Russia’s tragic war on Ukraine, the severe supply chain issues caused by offshoring of manufacturing and services to Asia. And we find ourselves in the grip of the most severe inflation outbreak in 40 years. No one can begin to predict how these situations will resolve themselves (even though it doesn’t stop many from trying)…much less when. Nor can anyone begin to imagine how the capital markets will adapt to said resolution(s). We are once again in a perfect cloud of unknowing.

    It is also – and this is what we find human nature can often be bitterly incapable of grasping – irrelevant to the investment policy of a long-term, goal focused, plan-driven investor. And I say again: current events are perfectly irrelevant to the investment policy of the long-term equity investor.

    What is the essence of successful long-term equity investing? It is the continuing practice of rationality under uncertainty. To me it means basing our investment policy on our financial plan as distinctly opposed to a view of the economy and the markets. This is where rationality begins and ends.

    Two years ago, we could not begin to imagine how lethal the pandemic was going to be, nor when effective vaccines would become available in sufficient quantity. Today, we can’t anticipate what Putin will do in Ukraine, nor how the back of this inflation will ultimately be broken. Nothing has changed; we’ve just moved on to a different set of unknowables.

    Meanwhile our clients’ retirement dates are bearing down on them at the same pace. The amount of money they need to accumulate has if anything gone up with inflation. And the only hope they have in the world for a secure retirement and meaningful legacy are the premium return of shares of brilliantly managed companies, whose short to intermediate-term corrections cannot be anticipated, much less timed.

    What we can know amid all this uncertainty—and just about all we need to know—is that the great companies in Australia and the world are already adjusting to this reordering. Today’s crisis invariably becomes yesterday’s news. Not only will you not be worried about this stuff ten years from now, you won’t even remember it.

    It all comes down to the main reason you hired us, to acting vs. reacting: keeping your head down and continuing to fund your plan, looking neither to the right nor to the left. Looking at history, not headlines.

    This is a glorious time to be a mainstream share investor for the long haul – even if, just at this moment,it feels like we can’t see a foot in front of our faces.

    We realise that on any given day, optimism can often sound like a crazy concept while pessimism on the other hand can feel like a good advice from a friend. We also realise that ours may be the only calm voice of long-term optimism you hear. We just want to make sure you hear it. Today’s the day.


    Key takeaways:

    • Try to minimise the noise. If news headlines make you feel uncomfortable,reduce your exposure to them. Their objective is to capture your attention, not to provide you with rational investment strategy.
    • Follow your investment plan, not headlines. Your plan is carefully designed to help you reach your life goals. If your goals haven’t changed, your investment strategy most likely doesn’t need changing. Only people without plans follow the headlines (they have nothing else to focus on)
    • Remember fundamentals. History doesn’t repeat but it rhymes. Look at the spread between the real-life returns (after inflation) of growth assets like shares and the real-life returns of cash and bonds.
    • Price versus value. When price (e.g. share price) of an asset decreases, the value of investing in that assets increases (and vice versa). If you’re still contributing to your investments/super, lower share market prices represent better value for your money.
    • Income vs account balance. If you already retired and your investment objective is to generate a lifestyle sustaining income, that income is paid based on the amount of your investment units, not your account balance. Make sure you focus on the right thing.
    • Optimism is the only realism. Having the faith in the future is number one investment principle we follow. It always gets tested when markets correct, and it can make all the difference.

    If you get ever concerned about your investment strategy, please always contact your adviser before you make any decisions. It’s one of the main reasons you hired us.


    Michal Bodi
    Partner and Senior Financial Planner


    Do you have a long-term investing strategy in place?

    Speak with one of our Financial Planners about the best investing approach for your circumstances, either book a meeting or get in contact with us on 02 9328 0876.


    Article by Michal Bodi | Partner and Senior Financial Planner

    General Disclaimer: This article contains information that is general in nature. It does not take into account the objectives, financial situation or needs of any particular person. You need to consider your financial situation and needs before making any decisions based on this information. Please seek personal financial advice prior to acting on this information.

    Where to start for retirement planning

    Where do you start? What do you need to consider? Will your capital go the distance and be able to sustain your lifestyle?

    These are the types of questions we cover when working with clients on their retirement strategies.


    Want to hear more about our retirement strategy process?

    Speak with one of our retirement strategists to go over your personal situation. Call us to arrange an appointment on 02 9328 0876.


    General Disclaimer: While every care has been taken in the preparation of this document, Sydney Financial Planning and Charter FP make no representations or warranties as to the accuracy or completeness of any statement in it. This article contains information that is general in nature. It does not take into account the objectives, financial situation or needs of any particular person. You need to consider your financial situation and needs before making any decisions based on this information. Please seek personal financial advice prior to acting on this information.

    Where can advisers add the most value

    You can see us as a trusted guide in an ever changing landscape. We put more clarity around things and help keep clients on track with their goals.


    Still have some questions?

    If you want to discuss how we can work with you in more detail. Call us to arrange an appointment with one of our advisors on 02 9328 0876.


    General Disclaimer: While every care has been taken in the preparation of this document, Sydney Financial Planning and Charter FP make no representations or warranties as to the accuracy or completeness of any statement in it. This article contains information that is general in nature. It does not take into account the objectives, financial situation or needs of any particular person. You need to consider your financial situation and needs before making any decisions based on this information. Please seek personal financial advice prior to acting on this information.

    Cashflow remains king

    Cashflow remains king

    Cashflow remains king

    Both are equally important, and if I had a dollar for each time I had a discussion with a client about how much is enough cash in a portfolio, I’d be a wealthy man.

    Today’s challenging periods have reminded us why it remains so critical our clients maintain a cash reverse and have a sound understanding of their cashflow positions (both personally and within their investment accounts).

    Over the last few years our clients have avoided selling growth assets in a downmarket and we want to keep it this way for as long as we can. We’ve managed to do this by putting in place cash reserves for our retired clients so they can continue to meet their pension payments and by putting in personal cash reserves to meet any unexpected expenses and avoid the need to make withdrawals from their investment accounts at an unfavorable time and at a discount. Our accumulators have been maintaining cash at bank to support any disruptions to their employment income.

    So back to the question, how much cash is enough? Everyone has a safety blanket number, however when determining cash allocations for our clients it really depends on their life stage. Accumulators may only need to hold 2% – 5% of cash in their portfolio’s whereas retired clients will need to hold much more than this.

    Min cash holdings for our retired clients can range from 1 – 3 years pension payments. The biggest trade off being the low return generated by cash exaggerated by interest rates being at an all-time low. A high cash allocation will have a larger drag on the long term return of your investment portfolio and ultimately impact the longevity of the account. So generally speaking, the higher the account balance the less cash allocation necessary (as a % of account balance).

    The Government has continued to help people preserve cash positions by reducing the minimum pension requirements by 50% for retirees drawing from their accountbased pensions again for the 2022/23 financial year. The minimums are:

    Age

    Normal Rate

    New rate for 2022/23

    Under 65 4.00% 2.00%
    65-74 5.00% 2.50%
    75-79 6.00% 3.00%
    80-84   7.00% 3.50%
    85-89 9.00%  4.50%
    90-94 11.00% 5.50%
    95 and over 14.00% 7.00%


    With limited opportunity for travel and a reduction in discretionary spending we’ve seen many of our clients requiring less cash to meet their living expenses. This has provided us with an opportunity to reduce payments to our pension clients over the past 12-24 months.

    However, with inflation looming we expect to see an increasing pressure on the need to increase pension payments as the cost of living increases over the next 12 -24 months.

    How can we better manage our cash positions in our investment portfolio’s going forward?

    Most of our clients have been fortunate to save more in their personal bank accounts which will help to fund travel and discretionary spending as the world continues to open up post covid. This will alleviate pressure on making large increases to pension payments in the short term. We have prepared and factored a risking cost of living into your financial plan and investment portfolios as our financial modelling allows for a CPI increase in pension payments annually.

    For our retired clients, or those transitioning to retirement its prudent to review the cashflow within your pension account. This is the cornerstone conversation at all our review meetings. Money in (distributions from our investments) and money out determine our cashflow position with pension payments making up the bulk of money going out. If there’s an opportunity to hold or even reduce your pension payments this coming year before we see significant inflation, we will be discussing this with you at your annual review meeting.

    Do you have the right amount of cash reserves?

    Speak with one of our Investment and retirement specialist about the best strategy for your circumstances, either book a meeting or get in contact with us on 02 9328 0876.


    Article by Gary Winwood-Smith | Senior Financial Planner

    General Disclaimer: While every care has been taken in the preparation of this document, Sydney Financial Planning and Charter FP make no representations or warranties as to the accuracy or completeness of any statement in it.This article contains information that is general in nature. It does not take into account the objectives, financial situation or needs of any particular person. You need to consider your financial situation and needs before making any decisions based on this information. Please seek personal financial advice prior to acting on this information.


    Rising importance of aged care planning

    Rising importance of aged care planning

    Rising importance of aged care planning

    This can be a really difficult time for families as our elders come to terms with their new circumstance.

     There are support services available for our loved ones in their homes or in a place that caters for their special needs.

    The Aged Care Sector offers help for both but can be difficult to navigate. Where do I start? Who do I talk to? What will they have to pay? How will it affect their home? How does it affect their Aged Pension? What home is best to cater to their needs.

    These questions and more come up in what can be a very confusing and emotional time.

    Important considerations for Aged Care

    • Does my elderly relative need support to stay at home, what are the Aged Care Home Packages available and how do I apply for them?
    • Does my elderly relative need to go into Aged Care, what facility would they like to go to and what are their particular needs (there are different levels of cover depending on the relative’s medical needs and not all Aged Care facilities cover all areas of need)?
    • How do I start the process of getting them into Aged Care?
    • How do I go about contacting the facilities and what is needed by them before they will accept someone?
    • Can I or anyone else speak to Aged Care on my elderly relative’s behalf?
    • How does my elderly relative pay for care and what are their options (There are at least four different payments for Aged Care that differ in complexity)?
    • What government or Centrelink assistance is available and what to do with the family home?

    icon quoteLife threw a curve ball when Mum was no longer able to make financial decisions about her future. Navigating the aged care system left me utterly confused. I knew what we needed to achieve for mum but having the know-how was another matter. Andrew Tate was brought into this process and helped us not only establish clear goals but produced a comprehensive strategic paper that compared scenarios to achieve such goals. He comprehensively walked us through the findings to the point where we felt 100% confident in making the same decisions that a short time ago seemed overwhelming. I am incredibly grateful to Andrew for his precise knowledge and desire to help my family.’

    Sasha Campbell (Daughter of Estelle Pulman who recently went into Aged Care)

    These are just some of the questions that have to be considered for Aged Care and the answers can have a varying effect on each of them.

    At Sydney Financial Planning we understand the complex rules around Aged Care. As Aged Care specialists we understand how sensitive this situation can be when dealing with your elderly relatives. Let us work together with you to find a solution that will satisfy your loved ones. Call our team to have a discussion around any prospective family members who may need extra care in their twilight years.


    If you aren’t sure how to proceed, lets start with a call…

    Speak with one of our Aged Care Specialists about the best approach for your circumstances, either book a meeting or get in contact with us on 02 9328 0876.


    General Disclaimer: While every care has been taken in the preparation of this document, Sydney Financial Planning and Charter FP make no representations or warranties as to the accuracy or completeness of any statement in it.This article contains information that is general in nature. It does not take into account the objectives, financial situation or needs of any particular person. You need to consider your financial situation and needs before making any decisions based on this information. Please seek personal financial advice prior to acting on this information.


    What to expect moving forward in investing July 2022

    What to expect moving forward after world financial markets fell early this year!

    What to expect moving forward in investing July 2022

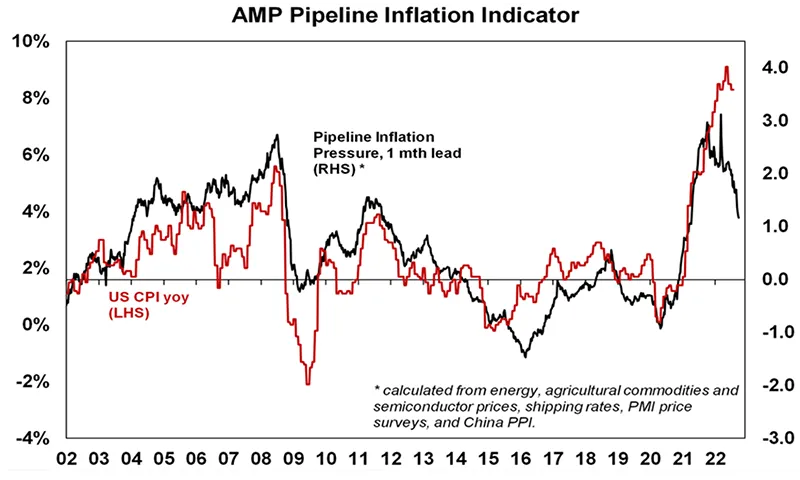
  • If inflation falls back to around 2.5% pa this suggests reasonable average returns ahead. The main downside risk would be if inflation continues to trend up.
  • The key is to have realistic return expectations and focus on assets with decent & sustainable income flows.
  • Introduction

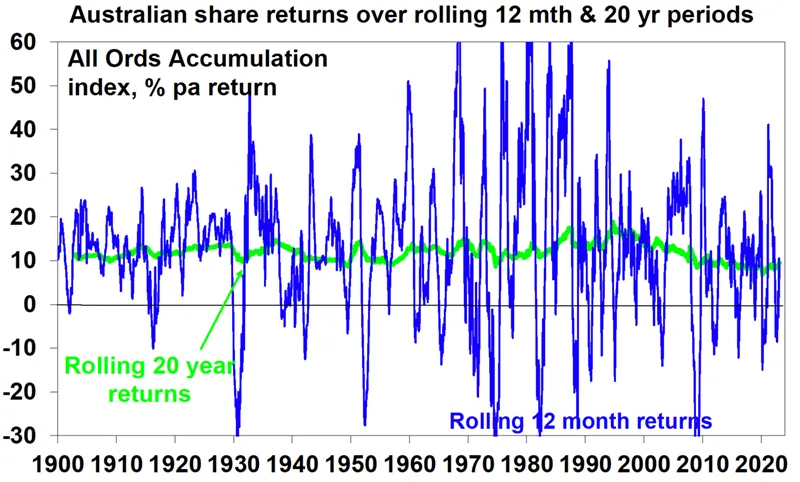
    The start of this year has been painful for investors with sharp losses in shares and bonds, dragging most superannuation funds into negative returns for the last financial year. And yet despite this setback and rough patches in 2015, 2018 and in early 2020 with pandemic lockdowns, median balanced growth superannuation funds returned 8.4% pa over the 10 years to June after fees and taxes. While dull compared to the double digit returns of the 1980s and 1990s, it’s pretty good once low average inflation of 2% pa over the last decade is allowed for.

    Balanced growth superannuation fund investment returns

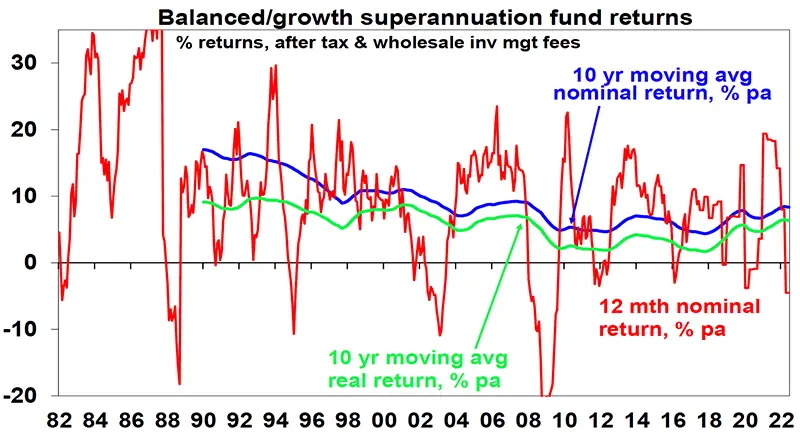
    Source: Mercer Investment Consulting, Morningstar, AMP

    However, returns have been boosted for decades by a “search for yield” as interest rates collapsed with falling inflation. This pushed down investment yields (bond yields, earnings yields on shares, rental yields on property, etc) and so pushed up asset values. But the sting in the tail was that ever lower yields meant an ever lower return potential for when yields eventually stopped falling. The good news in the recent fall in markets is that it’s pushed potential medium term returns back up a bit.

    Lower yields = lower return potential & vice versa

    Investment returns have two components: yield (or income flow) and capital growth. What gets confusing though is that the price of an asset moves inversely to its yield all other things being equal. For example, suppose an asset pays $5 a year in income and its price is $100 – this means an income flow or yield of 5%. If interest rates on bank term deposits are cut from say 3% to 1% this will likely encourage increased investor interest in the asset as investors will like its relatively high yield. Its price will then be pushed up – to say $120, which given the $5 annual income flow means that its yield will have fallen to 4.2% (ie, $5 divided by $120). This is great for investors who were already in the asset as its value has gone up by 20%. But its yield is now pointing to lower potential returns going forward (ie, 4.2% which is down from 5%), unless the yield continues to fall further boosting capital growth. But of course, there is a limit to this & it also works in reverse as maybe we are now starting to realise with the surge in inflation over the last year, which is pushing up interest rates, bond yields & yields on other assets. The plunge in yields since the early 1980s.

    In the early 1980s, the RBA’s “cash rate” was around 14%, 1- year term deposit rates were nearly 14%, 10-year bond yields were around 13.5%, commercial and residential property yields were around 8-9% and dividend yields on shares were around 6.5% in Australia and 5% globally. This meant investments were already providing very high income so only modest capital growth was needed for growth assets to generate good returns. And then with the shift from very high inflation in the early 1980s to very low inflation up until recently, the last 40 years saw a collapse in yields.

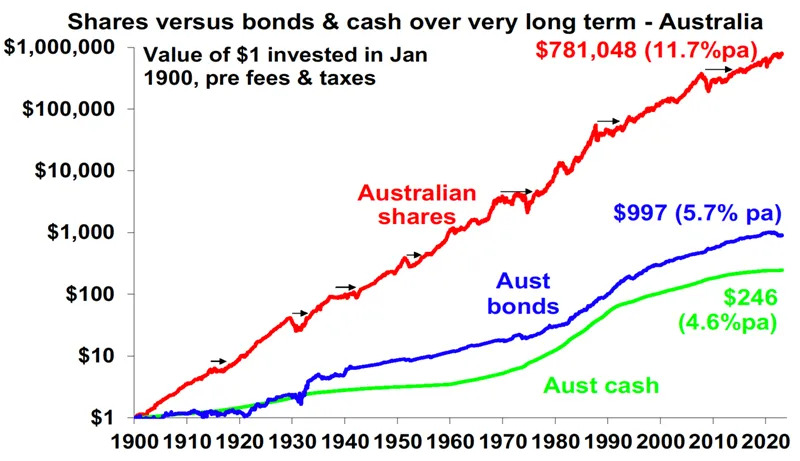
    This was led by falling interest rates and then yields on other assets were pushed down too. See the next chart. Consistent with the explanation in the previous section this led to strong average returns for diversified investors through the last 30 or 40 years, despite periodic setbacks like the 1987 crash, the tech wreck and the GFC.

    Australian investment yields

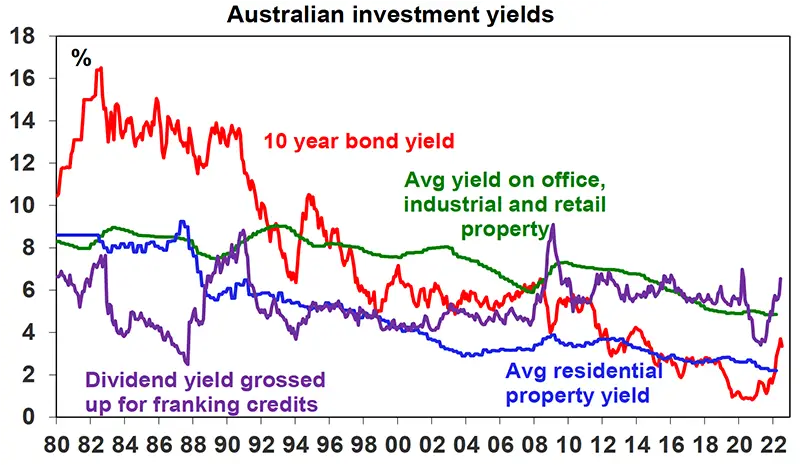
    Source: Bloomberg, REIA, JLL, AMP

    At their recent low point the RBA’s official cash rate fell to 0.1%, average bank 1-year term deposit rates fell to 0.25%, 10-year bond yields fell to 0.6%, gross residential property yields fell to 2.2%, commercial property yields fell below 5%, dividend yields fell below 4% for Australian shares (with franking credits) and just 2% for global shares. The problem was that with the cash rate and bond yields around zero there wasn’t much further for yields to keep falling. This saw our assessment of nominal medium term return projections for a balanced growth mix of assets fall below 5%. The good news is that with yields on cash, bonds and shares now up and asset prices down their return potential has improved.

    Medium-term (ie, 5 to 10 year) return projections

    Equities can offer another step up in return, but this is because they come with higher risk as they are subject to share market volatility and individual companies can go bankrupt wiping out share holder capital. Beyond this, private equity entails more risk again & so tends to command an even higher return premium. Each step up involves more risk, and this is compensated for with more long-term return. Of course, this neat relationship may not hold in the short-term – eg, government bonds have had worse returns over the last 12 months than shares. And its hard to place “crypto currencies” on the chart – they are very volatile but have not been around long enough to have confidence their long-term returns will compensate for this.

    Australian bonds - the higher the bond the better the returns

    Source: RBA, Bloomberg, AMP Capital

    Our approach to get a handle on medium-term return potential of major asset classes is to start with current yields and apply simple and consistent assumptions regarding capital growth. We also prefer to avoid forecasting and like to keep it simple.

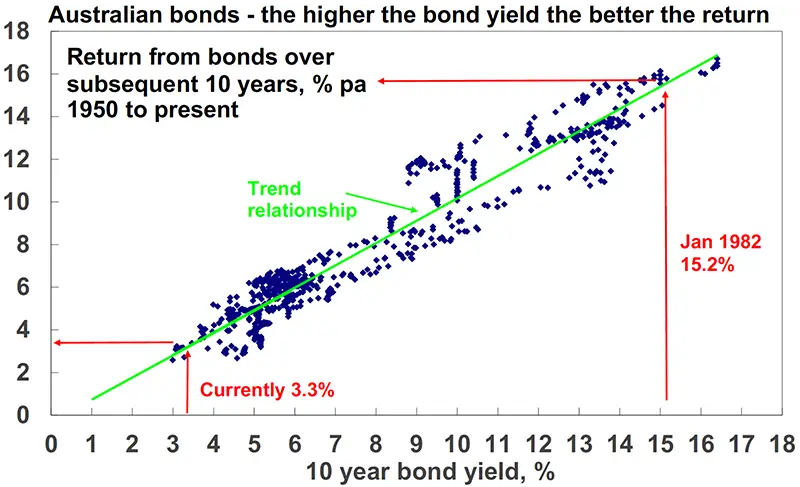
    • For bonds, the best predictor of future medium-term returns is current bond yields – as can be seen in the next chart. If a 10-year bond is held to maturity its initial yield (3.3% right now in Australia) will be its return over 10 years. This is still low historically but well up from a low of just 0.6% in 2020.
    • For equities, current dividend yields plus trend nominal GDP growth (a proxy for capital growth) does a good job of predicting medium-term returns.1 The Australian dividend yield is up by more than 1% from late last year.

    For equities, current dividend yields plus trend nominal GDP growth (a proxy for capital growth) does a good job of predicting medium-term returns.1 The Australian dividend yield is up by more than 1% from late last year.

    • For property, we use current rental yields and likely trend inflation as a proxy for rental and capital growth. The surge in online spending and “work from home” means greater than normal uncertainty around these returns at present.
    • For unlisted infrastructure, we use current average yields and capital growth just ahead of inflation.
    • In the case of cash, the current rate is of no value in assessing its medium-term return. So, we allow for our forecast cash rate over medium term.

    Our latest return projections are shown in the next table. The second column shows each asset’s current income yield, the third shows their 5-10 year growth potential, and the final column shows their total return potential. Note that:

    • We assume inflation averages around 2.5% pa, and this has been revised up from 1.5% pa (after years of low inflation pre-pandemic). We are assuming that central banks are successful in bringing inflation back to around target and keeping it there on average over the next 5-10 years.
    • We have cautious real economic growth assumptions reflecting the: retreat from globalisation, deregulation and small government in favour of populist, less market friendly policies; rising geopolitical tensions between the West and China/Russia; and aging populations and slowing population growth – resulting in slowing labour force growth. All of which will likely constrain capital growth for growth assets.

    Projected medium term returns, %pa, pre-fees and taxes

    Projected medium term returns

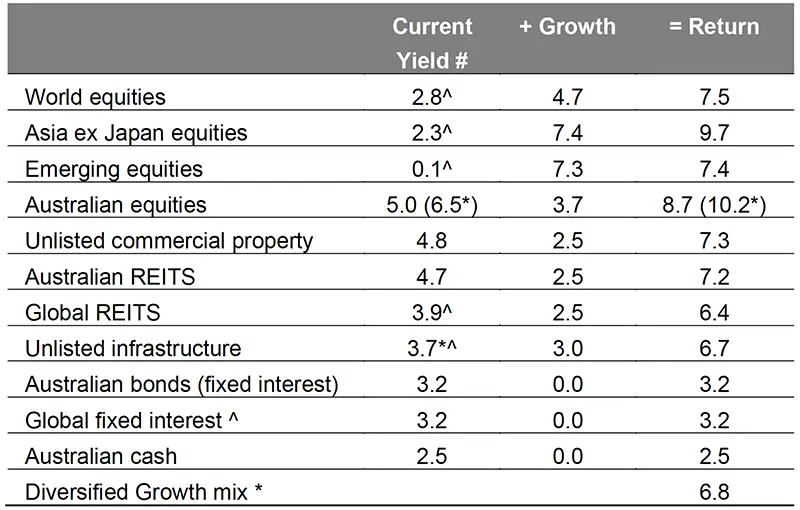
    # Current dividend yield for shares, distribution/net rental yields for property and duration matched bond yield for bonds. ^ Includes forward points. * With frankingcredits added in.
    Source: AMP

    Key observations

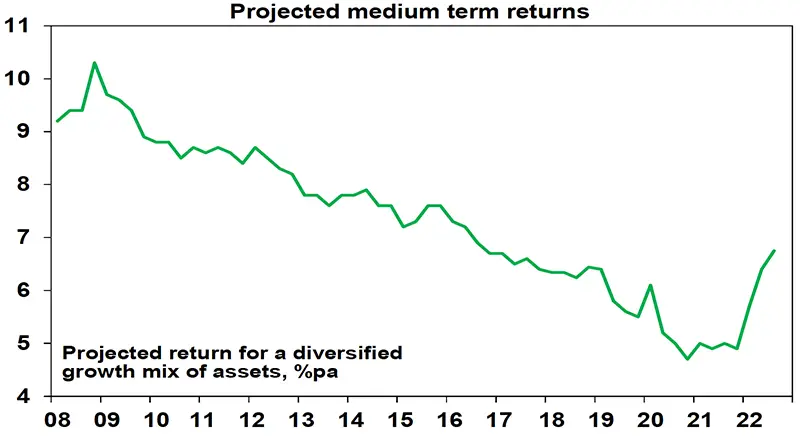
    • After falling for many years due to the fall in starting point yields for major assets the medium-term return potential using this approach fell below 5% in late 2020 but has improved this year to nearly 7%. This is partly due to a 1% higher medium term inflation assumption, but the rest is due to the rise in interest rates, bond yields and yields on assets including shares over the last year. This is the silver lining to the cloud (or rather storm) that has hit investment markets.

    Projected medium term returns chart

    Source: AMP

    • The return potential from commercial property and infrastructure has not improved much because their yields have not risen unlike those for bonds and shares (as their valuations lag). There is also greater uncertainty in the demand for office and retail space as the full impact from working from home and on-line retail is yet to impact rents.

    • The return potential of bonds is still poor but with now higher bond yields its well up from the lows of the last two years.
    • Australian shares stack up well on the basis of yield and Asian shares stack up well for growth potential.
    • The main downside risk to our medium-term projections is that inflation trends even higher driving a further trend rise in interest rates, bond yields and yields on other assets (including property & infrastructure) resulting in an ongoing drag on capital growth (ie, further reversing the “search for yield” driven surge in values over the last 30 years or so).

    Closing commentary

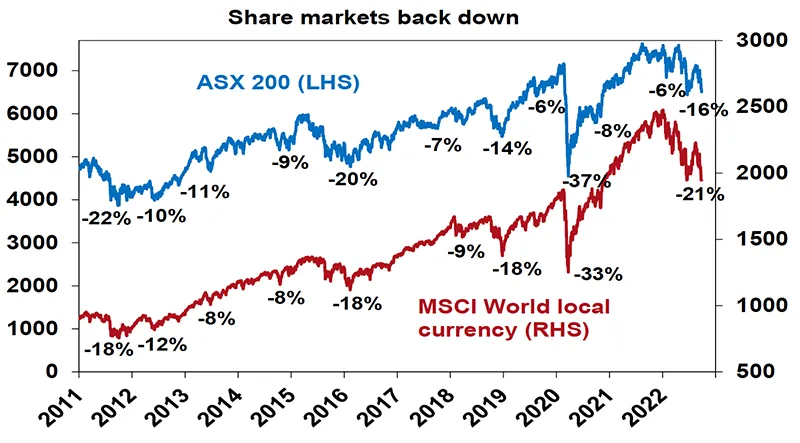
    Well, after a wild ride from Jan 2022 up to today, I need to congratulate our advised clients who have reacted to this fall in world Financial Markets in a positive way. Nobody was happy, but no one panicked, and many took advantage of the 20% drop in World share markets by buying discounted assets from silly people who panicked and gained a 20% discount on the purchase price.

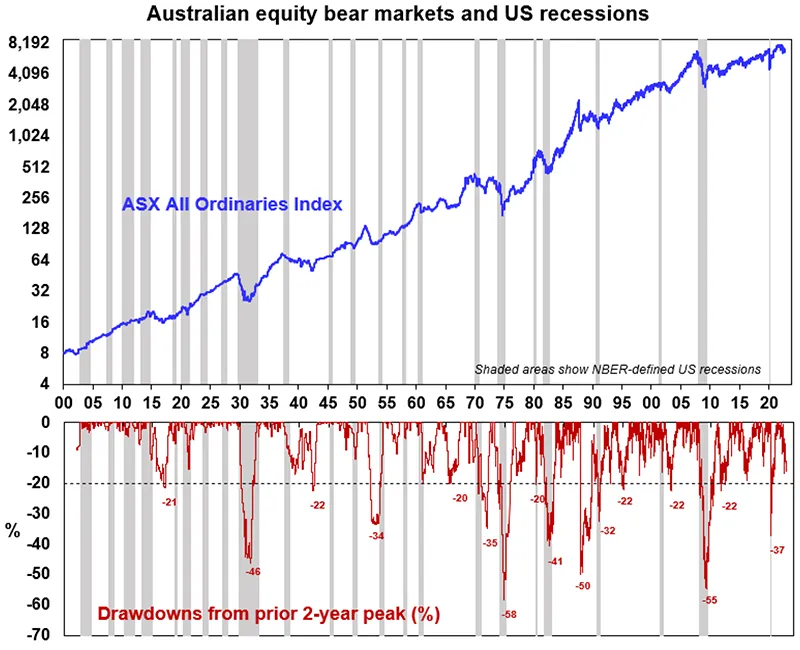
    We may still see more volatility over the next six months, but bear markets are painful in the short term and hard to pick. The upside is they present medium-term potential of shares and opportunities for our advised clients.

    Remember volatility is the price you pay for higher returns. If you buy quality assets and hold them for the medium to long-term, taking advantage of buying opportunities as they arise, you will be rewarded.

    Lastly, focus on quality assets that offer good sustainable income flows. Don’t be suckered into the next get-rich scheme, like many crypto investments that are basically junk and more like gambling than investing. When you are an advised client of Sydney Financial Planning, we will always give you “Advice that will stand the test of time”. That’s why I’m still here 35 years later writing this.

    Bill Bracey – CEO and Founder
    Sydney Financial Planning


    Is your portfolio well positioned for long-term returns and benefits?

    Speak with one of our Financial Planners about the best approach for your circumstances, either book a meeting or get in contact with us on 02 9328 0876.


    This article was prepared by William Bracey and Dr Shane Oliver. Dr Shane Oliver who provides economic forecasts and analysis of key variables and issues affecting, or likely to affect, all asset markets. He also provides economic forecasts and analysis of key variables and issues affecting, or likely to affect, all asset markets.

    Important note: While every care has been taken in the preparation of this document, AMP Capital Investors Limited (ABN 59 001 777 591, AFSL 232497) and AMP Capital Funds Management Limited (ABN 15 159 557 721, AFSL 426455) make no representations or warranties as to the accuracy or completeness of any statement in it including, without limitation, any forecasts. Past performance is not a reliable indicator of future performance. This document has been prepared for the purpose of providing general information, without taking account of any particular investor’s objectives, financial situation or needs. An investor should, before making any investment decisions, consider the appropriateness of the information in this document, and seek professional advice, having regard to the investor’s objectives, financial situation and needs. This document is solely for the use of the party to whom it is provided.

    General Disclaimer: This article contains information that is general in nature. It does not take into account the objectives, financial situation or needs of any particular person. You need to consider your financial situation and needs before making any decisions based on this information. Please seek personal financial advice prior to acting on this information.

    Process of transitioning to retirement

    What is transition to retirement?

    How do you balance enjoyment of working with slowing down? Can you even afford to slow down?


    If you have questions on your retirement planning, we’re here to help.

    Book a call with one of our retirement specialist to discuss your personal situation, to arrange an appointment contact our team on 02 9328 0876.


    General Disclaimer: While every care has been taken in the preparation of this document, Sydney Financial Planning and Charter FP make no representations or warranties as to the accuracy or completeness of any statement in it. This article contains information that is general in nature. It does not take into account the objectives, financial situation or needs of any particular person. You need to consider your financial situation and needs before making any decisions based on this information. Please seek personal financial advice prior to acting on this information.

    Are you getting the best rates?

    Loyal to a fault

    Are you getting the best rates?

    Sticking with the same loan longer than three years can cost borrowers thousands, with competition to win business resulting in new customers paying lower rates than existing ones.

    This so-called loyalty tax has become such a hot topic, the Australian Competition and Consumer Commission has recommended mortgage holders review their options regularly and consider switching to secure better terms. Now is a great time to follow that advice and get in touch.

    Rush to reset

    Homeowner refinancing has hit an all-time record in the past six months, and it’s easy to see why, with interest rates at long-term lows. But it’s not just fixed rates borrowers should have their eye on. Homeowners with variable rates need to check they aren’t unwittingly paying a loyalty tax too.

    Reserve Bank figures show owner-occupiers who took out new variable loans in October 2021 paid, on average, 2.63 per cent interest, while those with existing variable loans paid rates around 0.37 per cent higher rates at 3 per cent.1 On a loan around $350,000, that’s potentially adding an extra $1,295 in interest each year.

    As a customer there’s few things more galling than finding out someone who came to the party late has been given a bigger slice of cake than you. That’s why the most empowering thing you can do is to simply shop around, which is what I can do for you.

    Annual review

    Being financially savvy is about developing good habits, and one of the best for homeowners is to book an annual appointment to review your home loan arrangements.

    The start of a new year is the perfect time to dive in. People usually have a little more headspace before the year really ramps up and finding savings can be a great cure for that summer spending hangover.

    Speak to me to check how current variable rates compare, or perhaps it’s a good time to consider locking in a deal. Fixed rates have increased recently and speculation is mounting about a possible official interest rate rise in late 2022 or early in 2023.

    More than interest only

    Of course, refinancing isn’t always about interest rates alone, although they are a big part of the equation. It may be about building more flexibility into your loan with offset and redraw facilities, the ability to make additional repayments, or unlock equity for a renovation, a major purchase or holiday.

    Some borrowers may even want to consider options such as splitting a home loan between both fixed and variable options.

    It’s all about what your goals and priorities are right now, and we all know that can change unexpectedly year on year.

    Broker insight

    The home loan market has never been more competitive and we’re adding more lenders to our panel each year, with more loan products and features. It can be daunting, but it’s also where I can offer you an advantage in guiding you through what’s out there to meet your needs.

    I can also help calculate how any potential savings stack up in the short and long term against any search and switch costs. It’s important to stay on top of rates and offerings in a fast-moving market. So, get in touch to arrange a quick check-up for your home loan.


    Need some help working out if you can get a more suitable rate for your mortgage?

    Get some professional advice from our Mortgage expert Leigh Morris, call 02 9328 0876 to arrange a meeting.


    Article by Leigh Morris  – SFP Financial

    1 Lenders’ Interest Rates, Reserve Bank of Australia (published monthly online: rba.gov.au/statistics/interest-rates/#lenders-rates-table)

    General Disclaimer: While every care has been taken in the preparation of this document, Sydney Financial Planning and Charter FP make no representations or warranties as to the accuracy or completeness of any statement in it.This article contains information that is general in nature. It does not take into account the objectives, financial situation or needs of any particular person. You need to consider your financial situation and needs before making any decisions based on this information. Please seek personal financial advice prior to acting on this information.


    Topping up super with ‘catch-up’ contributions

    Topping up super with ‘catch-up’ contributions

    Topping up super with ‘catch-up’ contributions

    Depending on your circumstances, this could help you to maximise tax-effective super contributions and invest more for retirement.

    How does the strategy work?

    If your concessional contributions (CCs) in a financial year are below the annual CC cap, you’re able to accrue these unused amounts and carry them forward. This applies to unused cap amounts since 1 July 2018 and can be carried forward for up to five years. This means if you meet certain eligibility rules, you’ll be able to make larger CCs in a later financial year.

    This may give you greater flexibility to make larger CCs when your circumstances allow. This may be helpful if, for example, you have irregular employment income, fluctuating income or have had time out of the workforce.

    What’s the benefit?

    The amount you contribute is generally taxed at the concessional rate of up to 15%1. Once contributed, any earnings are also taxed at a concessional rate of 15%, rather than your marginal rate, which could be up to 47%2. Depending on your circumstances, this strategy could result in a tax saving of up to 32% and enable you to increase your super savings.

    Key conditions

    To be eligible to utilise your carried forward unused CCs by making a catch-up contribution you must:

    • have a ‘total superannuation balance’3 below $500,000 on the prior 30 June
    • be under 75 and meet the work test rules (or be eligible to apply the work test exemption) if you’re aged 67 to 74, and
    • have unused CC cap amounts accrued from one of the five prior financial years (but not before 2018/19).

    Accruing unused CC cap amounts

    The first financial year you could accrue unused CCs was in 2018/19. Unused CC amounts can be carried forward for up to five years before they expire.

    Seek advice

    Your financial adviser can help determine whether this strategy is right for you. They can also help you to work out what your available carried forward unused CC balance4 is and how much you’re eligible to contribute. Additional tax and other penalties may apply if you make contributions that exceed your available cap.

    To work out your carried forward amounts, you need to confirm the total amount of CCs you have made in each financial year since 1 July 2018. You can access information about your contributions by logging on to my.gov.au. Information displayed might not be up to date, so it is also important to keep accurate contributions records and enquire directly to your super fund before contributing.

    Case Study

    In 2018/19 and 2019/20, Fatima made CCs of $15,000, which was $10,000 less than the annual CC cap of $25,000.

    Fatima took 12 months maternity leave from 1 July 2020 and didn’t make any CCs in FY 2020/21.

    From 1 July 2021, Fatima returns to full-time work where her employer contributions (CCs) total $15,000 in 2021/22. This is $12,500 less than the annual cap that applies in this financial year ($27,500).

    Fatima receives an inheritance of $35,000 in 2021/22 that she wants to contribute to super. The table below shows how she can carry forward unused CCs to make catch up contributions in 2021/22 in later years.

    Financial year

    Annual CC cap amount

    Total CC cap including any carried forward CCs

    CCs made

    Unused CCs that may be carried forward

    2018/19 $25,000 $25,000 $15,000 $10,000
    2019/20 $25,000 $35,000 $15,000 $20,000
    2020/21 $25,000 $45,000 $0 $45,000
    2021/22 $27,500 $72,500 $50,000 $22,500

    Other key considerations

    • It’s important to check your total CCs for the financial year from all sources before adjusting your contribution strategy. CCs include:
      • contributions made for you by your employer as well as an estimate of any further employer contributions for the year
      • salary sacrifice contributions, and
      • personal contributions that you claim a tax deduction for.
    • For personal deductible contributions, you need to lodge a ‘Notice of Intent’ form and receive an acknowledgement from the superfund before certain timeframes, and alsobefore starting a pension, withdrawal or rollover.
    • If you are not eligible to make catch-up CCs, tax penalties apply if you exceed the annual CC cap of $27,500 in FY 2021/22.
    • You can’t access super until you meet certain conditions.


    If you aren’t sure how to proceed or if you meet the specific criteria…

    Speak with one of our Financial Planners about the best approach for your circumstances asap, either book a meeting or get in contact with us on 02 9328 0876.


    1 Individuals with income from certain sources above $250,000 in FY 2021/22 will pay an additional 15% tax on salary sacrifice, personal deductible and other CCs within your cap.

    2 Includes Medicare levy.

    3 Your ‘total superannuation balance’ includes all of your super accumulation interests and amounts held in superannuation income stream products. For more information, visit ato.gov.au, and check your total super balance by logging into my.gov.au.

    4 You can also obtain this information by logging into my.gov.au


    General Disclaimer: While every care has been taken in the preparation of this document, Sydney Financial Planning and Charter FP make no representations or warranties as to the accuracy or completeness of any statement in it.This article contains information that is general in nature. It does not take into account the objectives, financial situation or needs of any particular person. You need to consider your financial situation and needs before making any decisions based on this information. Please seek personal financial advice prior to acting on this information.